Hedera (HBAR) Futures Traders Maintain Bullish Outlook

0
0

Hedera (HBAR) has witnessed a steady decline in its value in the past few weeks. In the past 30 days, its price has decreased by almost 10%.
However, despite this, the altcoin’s futures traders have maintained a bullish bias toward it as they continue to demand long positions.
Hedera Futures Traders Bears a Burden
At press time, Hedera (HBAR) traded at $0.1031. During the last month, its price peaked at $0.12 on May 17 and has since declined by 16%.
Despite the fall in altcoins’ prices over the past few weeks, their future market activity has continued to grow. First, their open interest has trended upward since the beginning of the month. At $60 million as of this writing, HBAR’s futures open interest has surged by 18% since June 1.
An asset’s futures open interest measures the total number of its outstanding futures contracts or positions that have not been closed or settled. When it spikes, it signals that more participants are entering the market to open new positions.
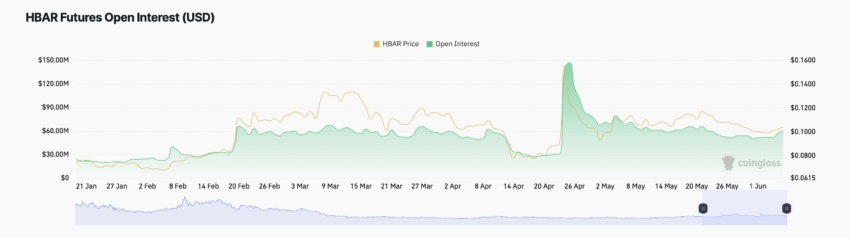 Hedera Open Interest. Source: Coinglass
In addition to HBAR’s rising open interest, its funding rate across cryptocurrency exchanges has remained positive. This trend has been since May 3, when the altcoin last recorded a negative funding rate.
Read More: What Are Tokenized Real-World Assets (RWA)?
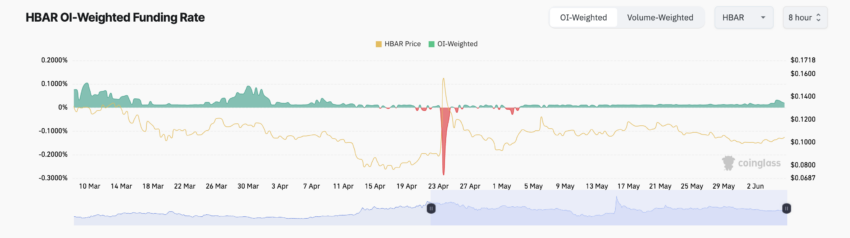 Hedera Funding Rate. Source: Coinglass
Funding rates are used in perpetual futures contracts to ensure the contract price stays close to the spot price.
When an asset’s futures funding rate is positive, there is a strong demand for long positions. It suggests that more traders are buying an asset in anticipation of a price increase than those expecting a dip.
HBAR Price Prediction: Price Trends Within a Range
The bias is different in the token’s spot market. Many buyers and sellers have avoided trading HBAR due to the uncertainty regarding its next price direction.
HBAR’s price traded close to its 20-day exponential moving average (EMA) at press time, confirming that the market was in consolidation.
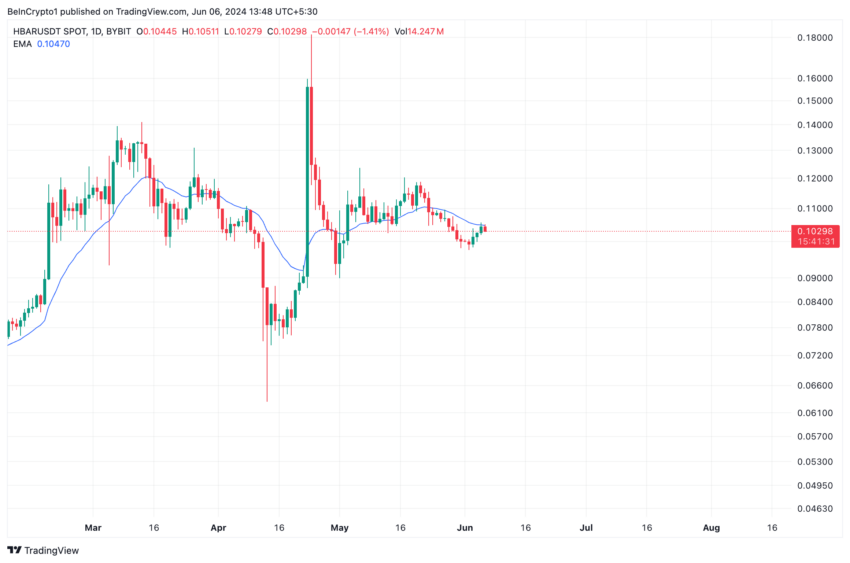 Hedera Price Analysis. Source: TradingView
An asset’s 20-day EMA tracks the average price of an asset over the past 20 days. When price trades close to this key moving average, it signals a period of sideways movement, with no strong uptrend or downtrend.
If buying momentum surges due to the activity of HBAR’s futures traders, its price might rally to $0.105.
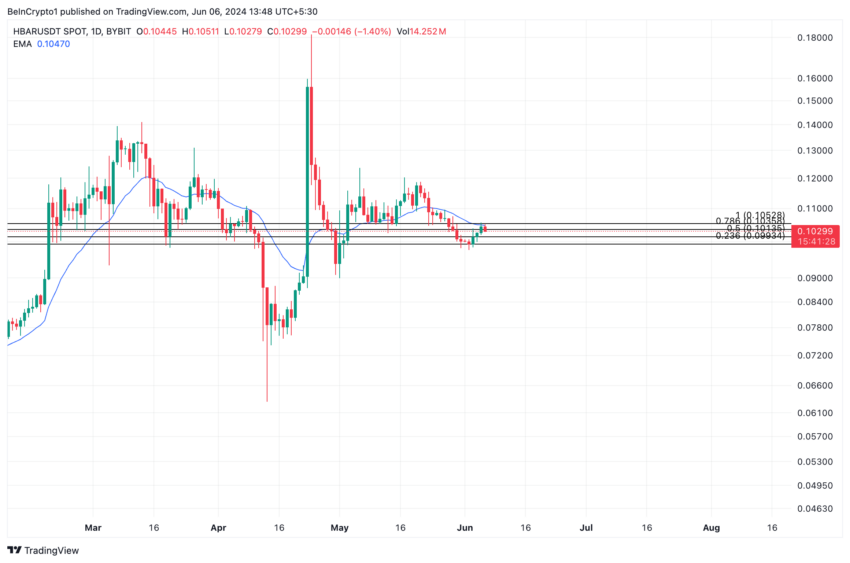 Hedera Price Analysis. Source: TradingView
However, if bear power grows and selling pressure mounts, HBAR’s price may fall to $0.09
0
0


 Manage all your crypto, NFT and DeFi from one place
Securely connect the portfolio you’re using to start.