Ethereum Flashes Fresh Sell Signal As $1,090 Downside Target Enters View

0
0


Ethereum is facing a sharper technical warning after a fresh TD Sequential sell signal appeared on the weekly timeframe. Analyst Ali Martinez warned that the indicator has been unusually accurate at major ETH turning points over the past year, with earlier weekly signals preceding large moves in both directions.
The latest signal arrives while ETH is already struggling near short-term support. Ethereum traded near $2,225 after falling more than 3% on the day, leaving the market close to the $2,250 level that traders have been watching as the immediate line between a normal pullback and a deeper correction.
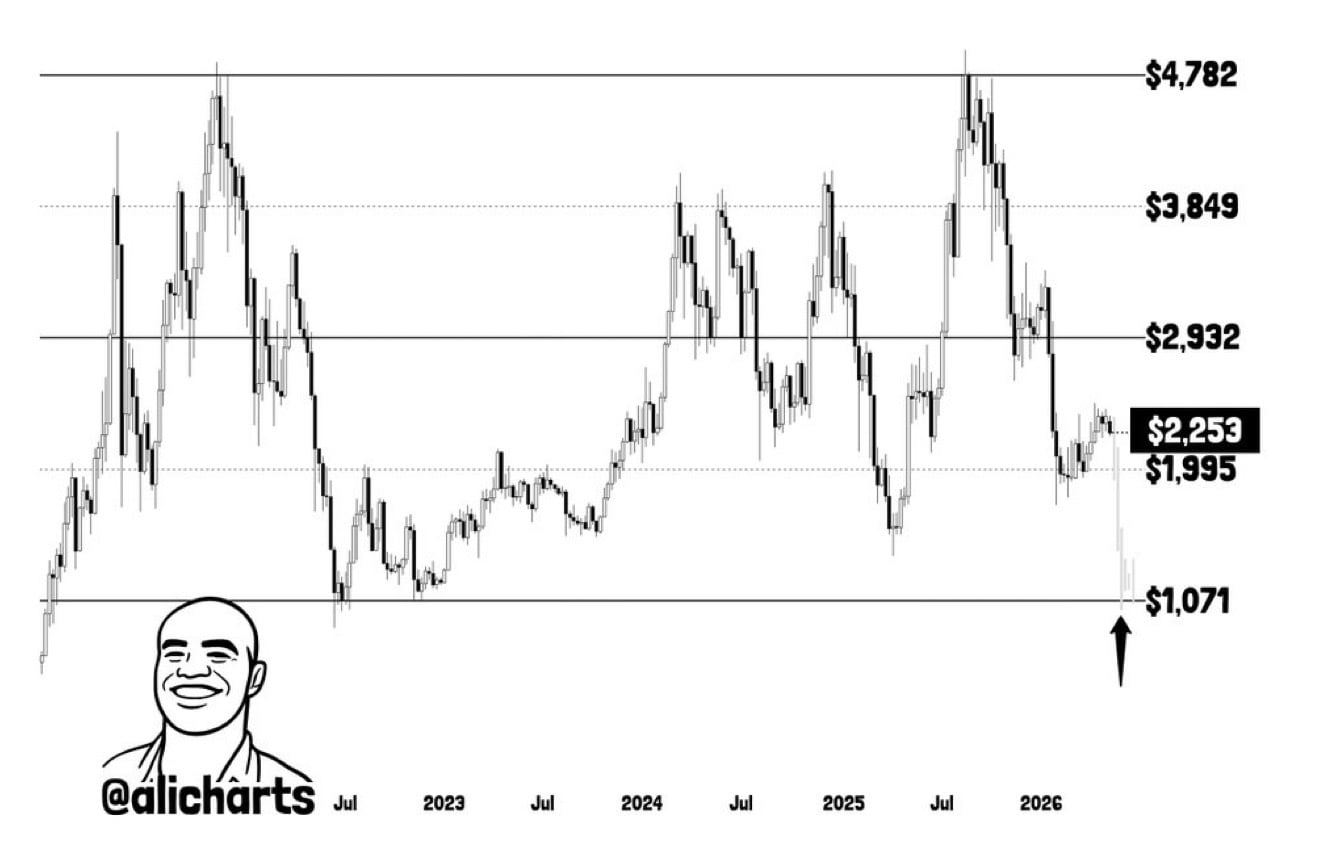
Martinez highlighted three downside targets if the selling pressure accelerates: $1,900 as the short-term level, $1,565 as the mid-term level and $1,090 as the longer-term target. A separate channel view from the same analyst also marks the bottom of Ethereum’s broader range near $1,071, an area he described as a strong potential buy zone if ETH eventually falls that far.
The call does not guarantee a straight-line crash. It does, however, give the market a defined downside map at a time when Ethereum is losing momentum, ETF demand remains weak and exchange-linked ETH flows are rising.
500,000 ETH Moves To Exchanges
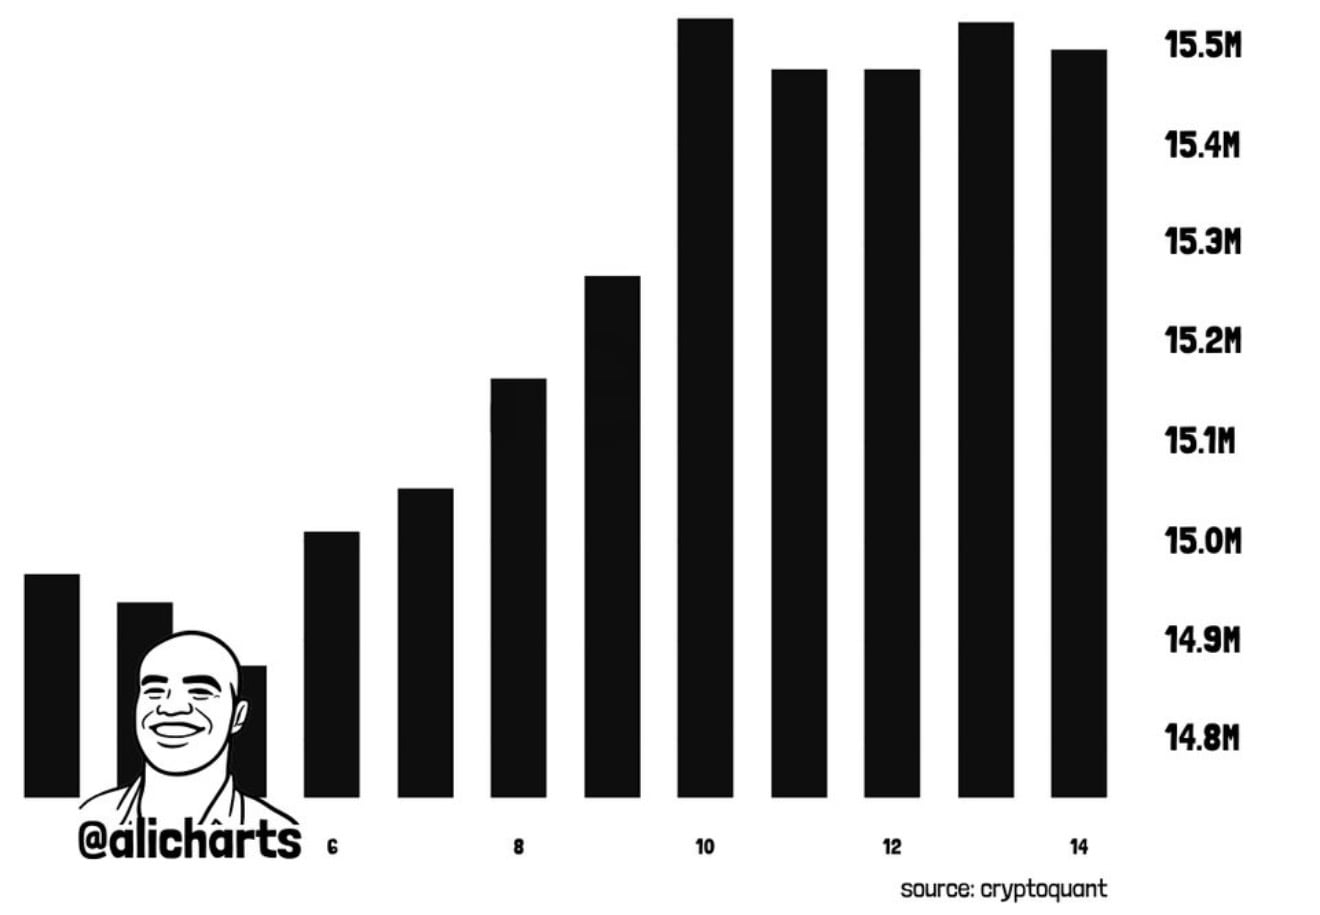
The technical warning is landing alongside a major on-chain pressure signal. More than 500,000 ETH has moved to exchanges over the past seven days. At ETH’s latest price near $2,225, that flow is worth about $1.11 billion. At prices closer to the recent $2,300 range, the same amount would be worth roughly $1.15 billion to $1.16 billion.
Exchange deposits are usually watched as potential sell-side pressure because they place coins closer to liquid order books. They can also reflect collateral movement, market-making inventory, OTC settlement, custody reshuffling, ETF-related flows or preparation for derivatives activity. The deposit itself is not proof that the full amount has been sold.
The timing is still uncomfortable for bulls. CoinGecko placed Ethereum’s market cap near $268.5 billion and 24-hour trading volume above $17 billion, while CoinGlass tracked open interest around $34.7 billion and more than $46 billion in 24-hour futures volume. High futures open interest near a major support zone can sharpen the next move if traders start cutting leverage.
That mix creates a fragile setup. A large inflow to exchanges can weigh on spot liquidity, while leveraged positioning can turn a support break into a faster move if stop-losses and liquidations begin stacking below the market.
$2,250 Is The First Line To Defend
The immediate level remains $2,250. Ethereum recently tested that area and failed to build a strong recovery above $2,300, leaving the chart exposed to another downside probe. A clean break below $2,250 would put $2,200 back in focus, followed by the $2,150 zone that has already been flagged in recent Ethereum technical analysis.
If $2,150 fails, the weekly sell-signal map becomes more relevant. The first larger downside target is $1,900, where buyers would likely test whether ETH is only flushing leverage or entering a deeper bearish structure. A failure there would shift attention toward $1,565, while the $1,071 to $1,090 area would represent a much deeper retest of the broader channel floor.
Ethereum’s exchange-supply trend had already started to shift before the latest alert. Recent Santiment-linked exchange supply data placed ETH supply on exchanges at 4.6%, up from 4.2% just 10 days earlier. That is still low by historical standards, but the direction matters because it shows more ETH returning to known exchange wallets after a period of tighter available supply.
ETF Outflows Add To The Caution Signal
ETF flows are not giving Ethereum bulls a clean offset. Farside Investors recorded $130.6 million of net spot ETH ETF outflows on May 12, followed by $36.3 million on May 13 and $5.6 million on May 14. The outflows slowed, but the three-day sequence shows that institutional demand has not been strong enough to absorb every bearish signal around ETH.
Large wallet movements have also kept traders alert. Earlier this week, the HyperUnit whale moved its last visible ETH to Binance, leaving its onchain holdings concentrated in Bitcoin. A single whale transfer does not define Ethereum’s market, but repeated exchange-linked ETH flows can change sentiment when price is already sitting near support.
Ethereum now has a clean but dangerous technical structure. Holding or quickly reclaiming $2,250 would reduce the risk that the exchange inflow becomes a larger selling narrative. Losing that level keeps $2,150 in play first, then opens the door to the weekly sell-signal targets at $1,900, $1,565 and the deeper $1,071-$1,090 channel floor if momentum breaks harder.
The post Ethereum Flashes Fresh Sell Signal As $1,090 Downside Target Enters View appeared first on Crypto Adventure.
0
0

 Manage all your crypto, NFT and DeFi from one place
Securely connect the portfolio you’re using to start.

0
0

0
0

0
0

0
0