
Sui Price Prediction: $SUI Tests Wedge Wall, Eyes $1.00

0
0

Sui price prediction traders have a compressing chart pattern to watch right now.
$SUI has been trading inside a falling wedge, and price has now worked its way up to press directly against the upper boundary of that structure.
A falling wedge is typically read as a pattern that resolves to the upside once price clears it, which is why this resistance test matters more than a routine bounce would.
Here is the full picture for this SUI technical analysis.
Sui Price Today: Live Data and 24-Hour Change
$SUI is trading at $0.7259 at the time of writing, up $0.003324, or 0.46%, over the past 24 hours.
Futures volume over the same period stands at $522.53 million, while spot volume sits at $96.64 million.
Market cap is holding at $2.94 billion, open interest is at $585.74 million, and circulating supply is 4.07 billion SUI against a total supply and max supply that both sit at 10.00 billion tokens.
Source: CoinGlass market data, September 1, 2026.
SUI Liquidation Data and Market Positioning
Liquidation flow over the past day leans toward longs, showing that traders betting on continued upside have taken the bigger hit as $SUI has run into this wedge resistance.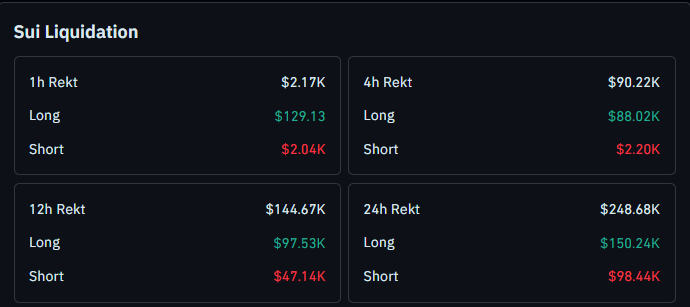 Over the last 24 hours, $248.68K in positions were liquidated, with $150.24K of that coming from longs against $98.44K from shorts.
The 12-hour window shows a similar lean, with $144.67K in total rekt, $97.53K from longs versus $47.14K from shorts.
The 4-hour window is even more skewed toward longs, with $90.22K liquidated overall and $88.02K of that coming from longs against just $2.20K from shorts.
The 1-hour window shows $2.17K rekt, with shorts taking the larger share at $2.04K against $129.13 from longs, a sign that the most recent short-term move has flipped the pressure the other way.
This $SUI liquidation data shows a market where longs have absorbed most of the pain pressing into this wedge resistance, which is typical of a level that has not given way yet.
Source: CoinGlass liquidation data, September 1, 2026.
Quick Take
-
CMP: $0.7260 on the 4-hour Binance perpetual chart
-
Bullish trigger: 4-hour close above $0.7642 needed to confirm a falling wedge breakout
-
Bullish continuation levels: $0.9564, then the psychological $1.00 mark
-
Bearish trigger: 4-hour close below $0.6510
-
Bearish target on breakdown: $0.5670
-
Data timestamp: September 1, 2026, 16:04 UTC+5:30
-
Risk note: Price is still trading inside the wedge and has not closed above resistance yet, so a confirmed close above $0.7642 is needed before this coin price prediction should be treated as a genuine breakout
Sui Technical Analysis September 2026
On the 4-hour SUI/USDT perpetual chart on Binance, price has been trading inside a falling wedge, a pattern defined by converging trendlines that slope downward together as volatility compresses.
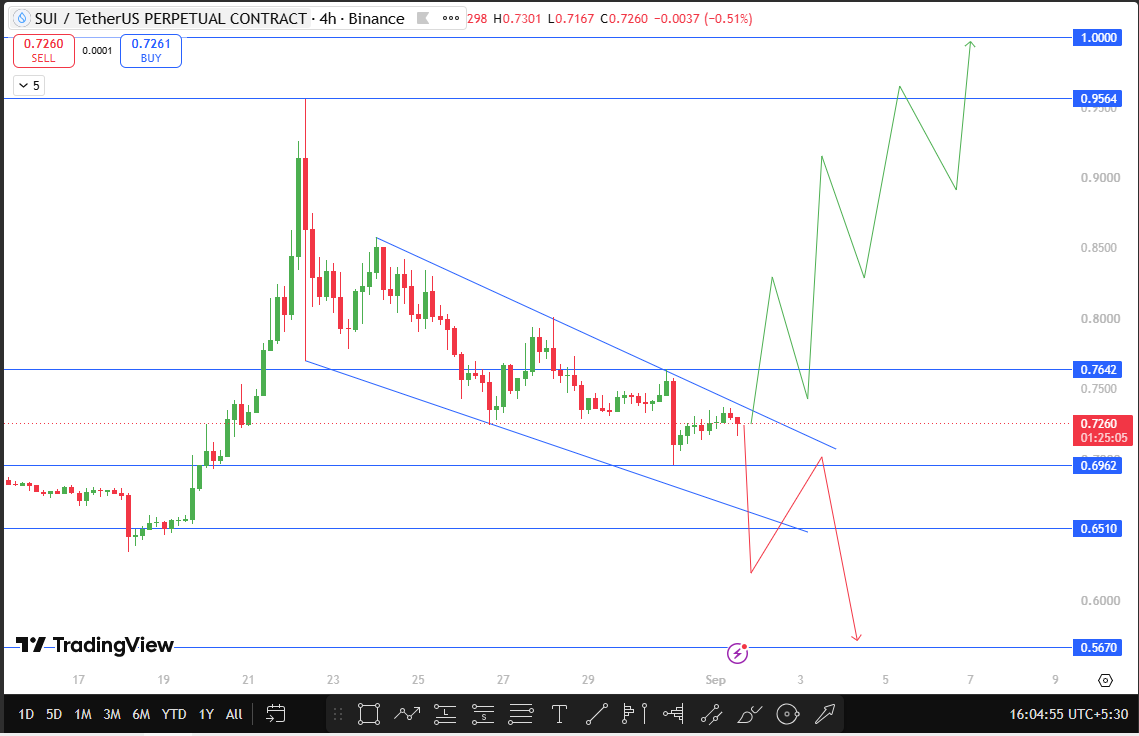 Price has now pushed up to test the upper boundary of that wedge directly, which is the setup at the center of this SUI trend analysis.
If price breaks and closes above $0.7642 on the 4-hour chart, that would confirm the wedge breakout, opening a path toward $0.9564, with the psychological $1.00 level standing as the extended target for this Sui rally prediction.
On the downside, if price breaks and closes below $0.6510, the next support to watch drops to $0.5670.
Falling wedges are generally treated as bullish continuation or reversal setups once price clears the upper trendline with volume, which is the confirmation this $SUI crypto forecast is waiting on.
Source: TradingView, SUI/TetherUS Perpetual, 4-hour chart, Binance, September 1, 2026, 16:04 UTC+5:30.
SUI Support and Resistance Levels
| Level Type | Price | Change from CMP | Note |
| Major Resistance | $1.00 | +37.7% | Psychological breakout target |
| Resistance 1 | $0.9564 | +31.7% | Extended upside target |
| Wedge Breakout Level | $0.7642 | +5.3% | Level that confirms wedge breakout |
| Current Price | $0.7260 | — | CMP on 4-hour chart |
| Interim Level | $0.6962 | -4.1% | Recent short-term level |
| Support 1 | $0.6510 | -10.3% | Wedge breakdown trigger |
| Support 2 | $0.5670 | -21.9% | Deeper support level |
Bull, Base, and Bear Case
In the bull case, Price clears this falling wedge and closes above $0.7642 with real follow-through, opening a path toward $0.9564 and then the psychological $1.00 level for this $SUI price prediction today.
The base case has price chopping between $0.6510 and $0.7642 for a while as the market keeps testing wedge resistance without a decisive close either way.
In the bear case, Price closes below $0.6510, breaking the wedge structure to the downside instead of the upside, and price works its way toward a retest of $0.5670.
Risks to This Sui Price Prediction
The biggest risk here is a rejection at $0.7642, since falling wedges do not always resolve bullish, and a failed breakout attempt here would keep $SUI capped inside the pattern for longer.
The concentration of long liquidations over the past day also shows that buyers have already been tested at this level once, and a repeat rejection could shake out more of that positioning.
Broader Bitcoin price action, shifts in overall crypto risk sentiment, and general altcoin trend analysis could all pull $SUI away from this setup regardless of how the wedge resolves.
This SUI breakout analysis is based purely on current chart structure and available data, and conditions can change quickly.
Glossary
CMP: Current Market Price, the price at which an asset is trading right now.
Falling Wedge: A chart pattern formed by two converging downward-sloping trendlines, typically viewed as a bullish setup once price breaks above the upper line.
Open Interest: The total number of outstanding derivative contracts that have not been settled.
Liquidation: The forced closing of a leveraged position when losses exceed the trader's available margin.
Disclaimer
This article is for informational purposes only and should not be considered financial advice. Cryptocurrency markets are highly volatile, and readers should conduct their own research before making any investment decisions.
0
0

 Manage all your crypto, NFT and DeFi from one place
Securely connect the portfolio you’re using to start.


