
BNB Price Prediction: This Breakout Could Send $BNB Skyrocketing

0
0

BNB started out as Binance's exchange token back in 2017, offering fee discounts to traders on the platform before growing into the native asset powering an entire chain used for everything from DeFi to gaming.
Years of quarterly token burns have steadily trimmed its supply along the way, a mechanic that's become as much a part of its identity as the exchange itself.
$BNB is currently trading at $607.08, down 1.0% over the last 24 hours, after moving between $605.38 and $613.73 during the session.
Live Market Data
Before getting into where this BNB price prediction leans, here's how BNB is positioned in the market right now, based on live trading data.
| Metric | Value |
|---|---|
| Price | $607.08 |
| 24h Change | -1.0% |
| 24h Range | $605.38 – $613.73 |
| Market Cap | $80.843B |
| Fully Diluted Valuation | $80.843B |
| 24h Volume | $489.729M |
| Circulating Supply | 133.164M |
| Total Supply | 133.164M |
| Max Supply | 200M |
| Total Treasury Holding | 686,076 BNB |
Source: $BNB market cap data taken from Coingecko, data as of Aug 14, 2026. Figures may vary slightly across other tracking websites.
Liquidation Snapshot
Liquidation data over the past 24 hours leans clearly toward longs getting squeezed, with $324.38K in total liquidations, of which $246.27K came from long positions against $78.12K in shorts. 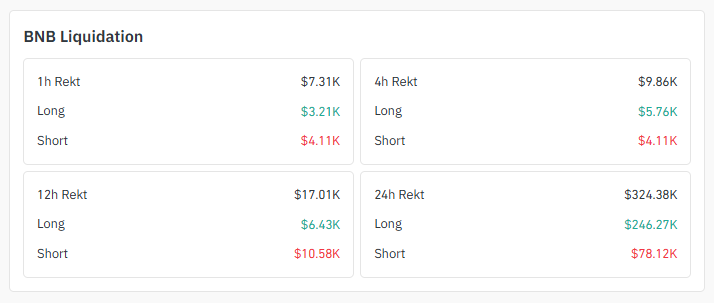
Source: Liquidation Data Taken From Coinglass.
That gap narrows on shorter windows, though. The 12-hour window actually flipped, with $10.58K in short liquidations outpacing $6.43K in longs, suggesting the pressure has shifted back and forth rather than running in one direction the entire day.
Exchange Volume
BNB's 24-hour trading volume totals $489.729M, and Binance dominates that figure with $236.76M on its own, more than the rest of the venues combined. 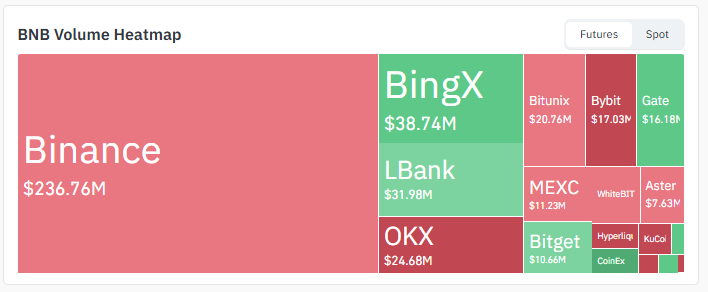
Source: Volume Heatmap Data Taken From Coinglass.
BingX follows at $38.74M, with LBank at $31.98M and OKX at $24.68M rounding out the next tier.
Smaller venues like Bitunix, Bybit, Gate, MEXC, and Bitget each contribute between $10M and $21M.
That heavy concentration on Binance itself isn't surprising given BNB's origins, but it does mean liquidity elsewhere is comparatively thin.
Key Takeaways
-
BNB is trading at $607.08, down 1.0% over the last 24 hours
-
1H chart shows BNB inside a descending channel, testing the lower half near $607
-
1D chart shows BNB inside a broader ascending channel, still trending up overall
-
24h liquidations hit $324.38K, mostly from longs ($246.27K)
-
Binance dominates 24h volume with $236.76M out of $489.729M total
Technical Analysis
Hourly Chart Analysis
The 1H chart currently has $BNB inside a descending channel, with price stepping lower after that earlier spike toward $620 faded out. 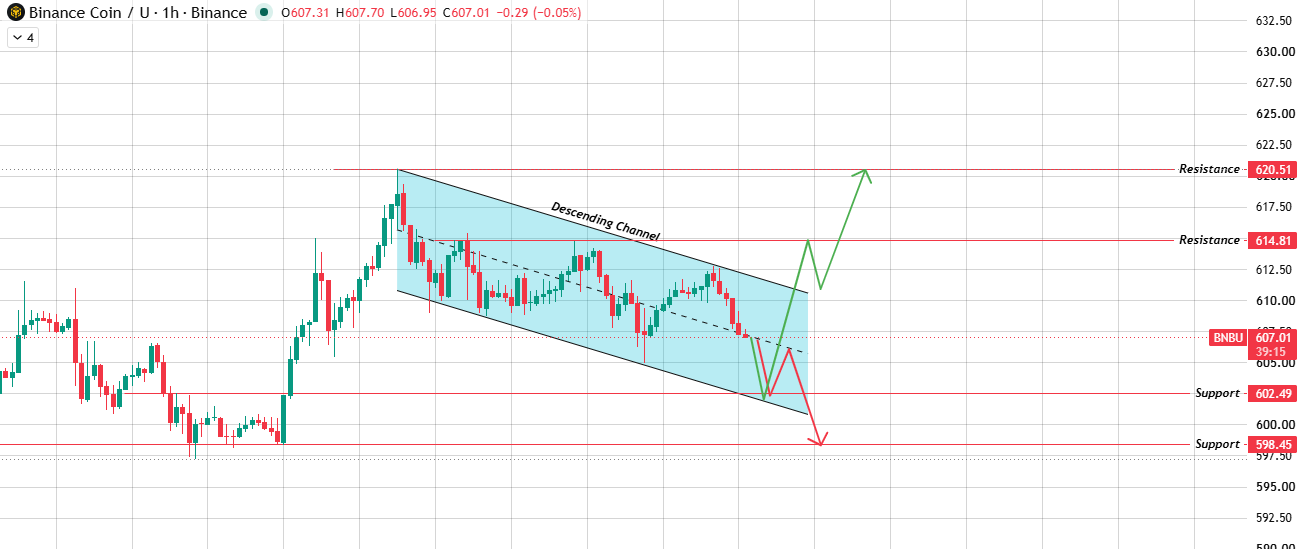
Source: Chart Taken From TradingView .
$BNB is now testing the lower half of the channel near $607.01. A break below the channel's floor with volume behind it exposes $602.49 first, then $598.45 beyond that.
If instead price holds and reclaims the upper boundary, $614.81 comes into range, with $620.51 as the next hurdle.
Short-term momentum here looks a touch heavier to the downside, at least until one boundary actually breaks with conviction.
Daily Chart Analysis
Zoom out to the 1D chart, and the picture flips. $BNB has been climbing inside an ascending channel for weeks, with each pullback finding buyers before the previous low. 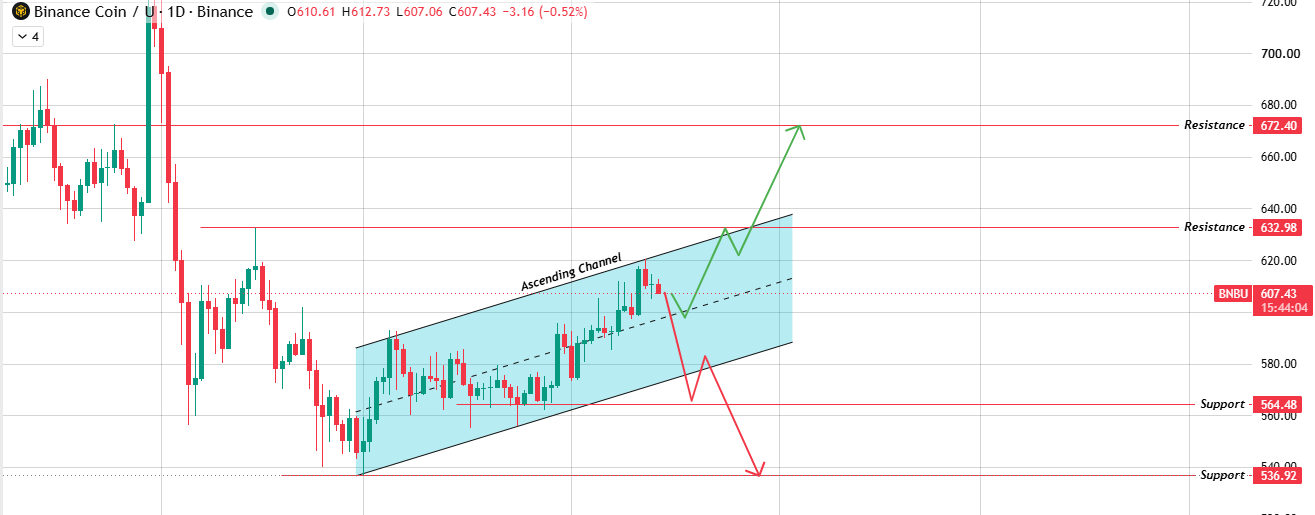
Source: Chart Taken From TradingView.
Price is currently pulling back a little within that channel near $607.43. Hold the channel's lower boundary, and a push toward $632.98 looks likely, with $672.40 further out if that clears too.
Lose the channel's lower boundary instead, and $564.48 becomes the first real support, with $536.92 as a deeper floor beyond it.
The bigger trend here still favors buyers as long as the channel structure stays intact.
BNB Support & Resistance Levels
| Timeframe | Support 1 | Support 2 | Resistance 1 | Resistance 2 |
|---|---|---|---|---|
| 1H | $602.49 | $598.45 | $614.81 | $620.51 |
| 1D | $564.48 | $536.92 | $632.98 | $672.40 |
Bull, Base, Bear Case
This BNB price prediction sits at an interesting fork, since the 1H and 1D charts are telling two different stories right now, and which one wins out will likely decide the next real move.
| Scenario | Price Level | Conditions | Invalidation |
|---|---|---|---|
| Bull Case | $614.81 – $672.40 | The 1H channel holds and reclaims the upper boundary, while the 1D ascending channel stays intact | Rejection at $614.81 and loss of the 1D channel's lower boundary |
| Base Case | $602.49 – $614.81 | Price stays contained between the two nearby levels without a decisive break | Close outside either the 1H or 1D channel boundaries |
| Bear Case | $598.45 – $536.92 | Break below the 1H channel support, followed by a break of the 1D ascending channel's lower boundary | Reclaim of $614.81 with strong volume |
Glossary
Ascending Channel: a price structure where each low sits a little higher than the last, boxed in by two rising parallel lines.
Descending Channel: the mirror image, where price keeps stepping down between two falling parallel lines.
Resistance Level : a price zone where selling pressure has historically stepped in and stalled upward moves.
Support Zone: a price area where buyers have repeatedly stepped in to catch falling prices.
Liquidation: the forced closure of a leveraged position when losses eat through the trader's margin.
Methodology
This BNB price prediction was built from multi-timeframe chart analysis (1H and 1D) submitted for review and cross-checked against live market data, exchange volume distribution, and liquidation figures. No price levels were extrapolated beyond what appeared in the source charts.
Disclaimer: This article is for informational purposes only and does not constitute financial advice. Cryptocurrency markets are highly volatile, and past chart patterns don't guarantee future outcomes. Always do your own research and consult a licensed financial advisor before making investment decisions.
0
0


 Manage all your crypto, NFT and DeFi from one place
Securely connect the portfolio you’re using to start.


0
0

0
0

0
0