
Optimism Price Prediction August 2026: $OP Scenario Analysis

0
0

A Coin Sitting at Its Own Two-Year Low, Right Before August Starts
Here's a question worth sitting with: why does a token backed by Ethereum's biggest scaling network keep printing fresh lows instead of bouncing?
That's the setup behind this optimism price prediction August 2026. $OP just touched a new all-time low days before the month even began. And the chart isn't offering much comfort yet.
So is there a floor here, or does August just keep grinding lower?
$OP Price Today: Live Data Behind This Forecast
Live data, per CoinMarketCap, as of July 30, 2026:
| Metric | Value |
|---|---|
| Price | $0.08752 |
| 24H Change | +0.2% |
| Market Cap | $200.13M (+0.2%) |
| 24H Volume | $40.47M (+9.92%) |
| Volume/Market Cap | 20.47% |
| 24H Range | $0.08612 – $0.09084 |
| Circulating Supply | 2.28B OP |
| Total Supply | 4.29B OP |
| Max Supply | 4.29B OP |
| All-Time High | $4.85 (Mar 6, 2024) |
| All-Time Low | $0.08578 (Jul 28, 2026) |
| CertiK Rating | 4.7 / 5 |
This optimism price prediction for August 2026 starts from a rough spot. The all-time low hit just two days ago. That's not a great look walking into a new month.
Will Optimism Go Up in August 2026? Technical Analysis
Both timeframes agree on one thing: a descending channel has capped $OP since early this year on the OP/USD TradingView chart. That agreement matters more than either reading alone.
Daily Chart: Optimism Price Prediction August 2026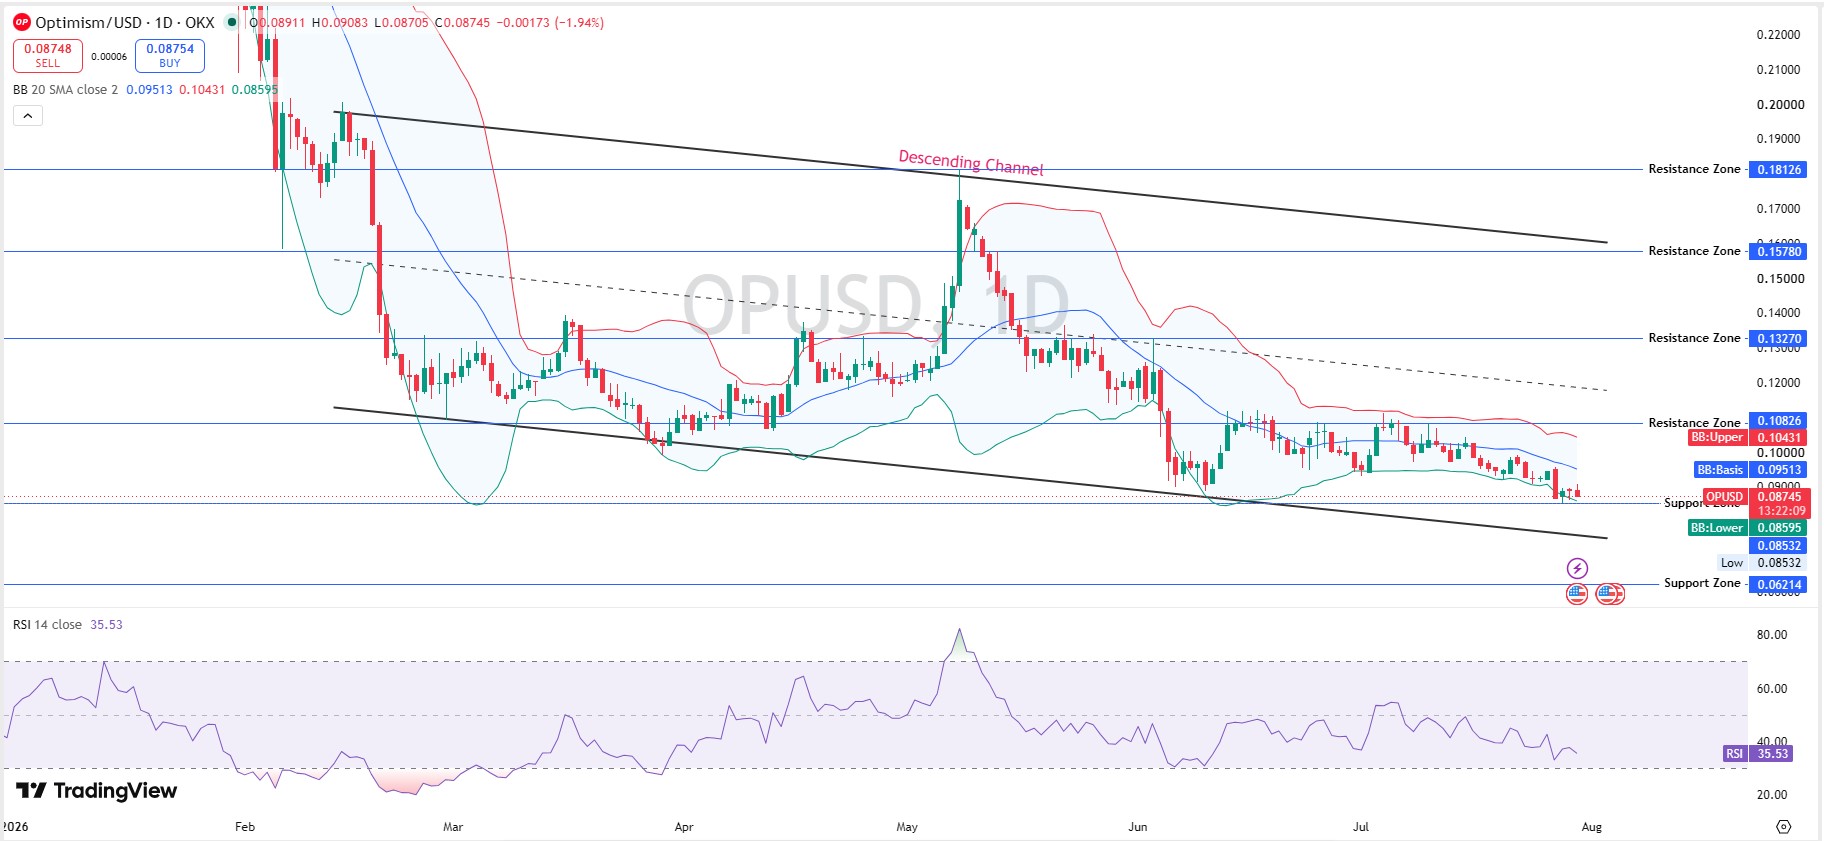
Daily RSI sits at 35.53, leaning weak, not yet oversold. Daily Bollinger Bands show a basis of $0.0951, an upper band of $0.1043, and a lower band of $0.0860. $OP trades below its own short-term average right now.
The daily descending channel still caps upside near $0.1083. A daily close above $0.1043 would be the first real crack in that structure.
Weekly Chart: Optimism Price Prediction August 2026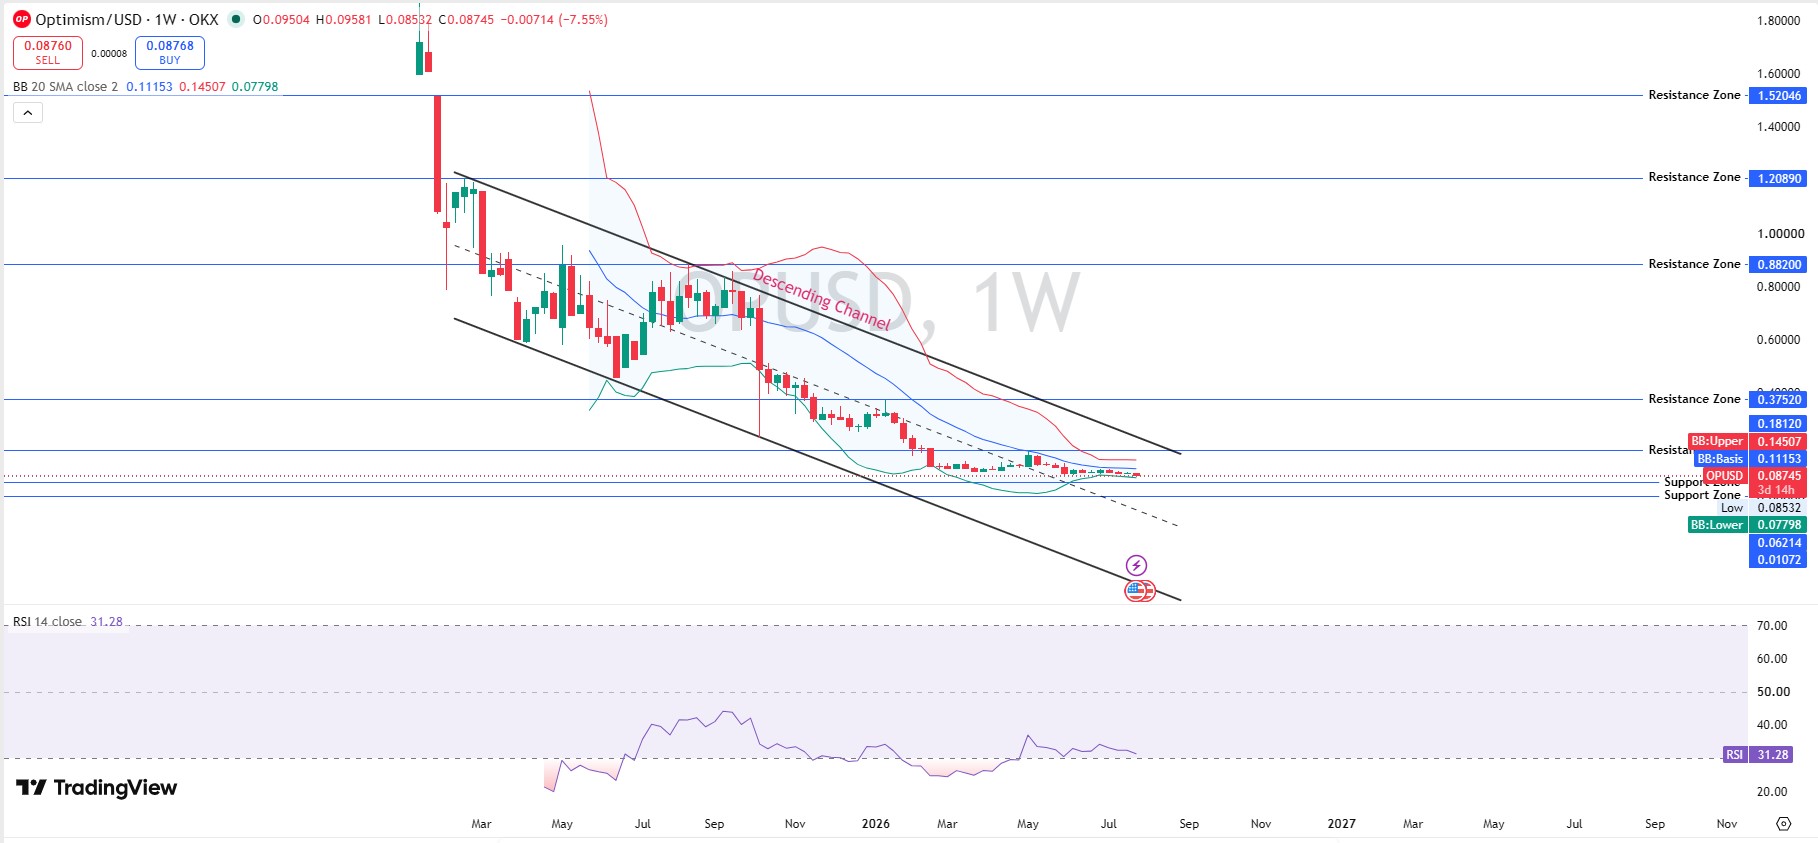
The weekly picture reads worse. Weekly RSI is 31.28, close to oversold territory. Weekly Bollinger Bands run from a $0.0780 lower band to a $0.1451 upper band, with a $0.1115 basis.
OP just closed the week down 7.55%. That's a heavy drop for one candle. The weekly descending channel is the bigger ceiling shaping this entire forecast, and until it breaks, rallies tend to get sold.
Key Levels: $OP Support and Resistance for August 2026
Resistance stacks at $0.1043, then $0.1327, then a heavier wall near $0.1578. Support sits at $0.0860, then $0.0780, with the recent low near $0.0858 acting as a psychological line in between.
A daily close above $0.1043 opens the door toward $0.1327. A close below $0.0780 shifts focus toward deeper downsides.
Optimism Price Prediction August 2026: Bull, Base, Bear
| Scenario | Outlook | What Needs to Happen |
|---|---|---|
| Bull Case | Clears the channel and runs toward $0.1327. | Daily close above $0.1043 while holding $0.086 support. |
| Base Case | Range-bound between $0.078 and $0.104. | Support holds, but breakout momentum remains limited. |
| Bear Case | Slips toward $0.078 or retests the $0.0858 low. | Support fails and ETH weakens further. |
Invalidation for the bullish op price target of August 2026: a daily close under $0.0860. A close under $0.0780 would confirm the deeper bear case.
Catalysts and On-Chain Drivers
Optimism just announced OP Enterprise, managed chain infrastructure aimed at institutions building on the OP Stack, tied to a new Ethereum institutional partnership. Early days, not yet reflected in price.
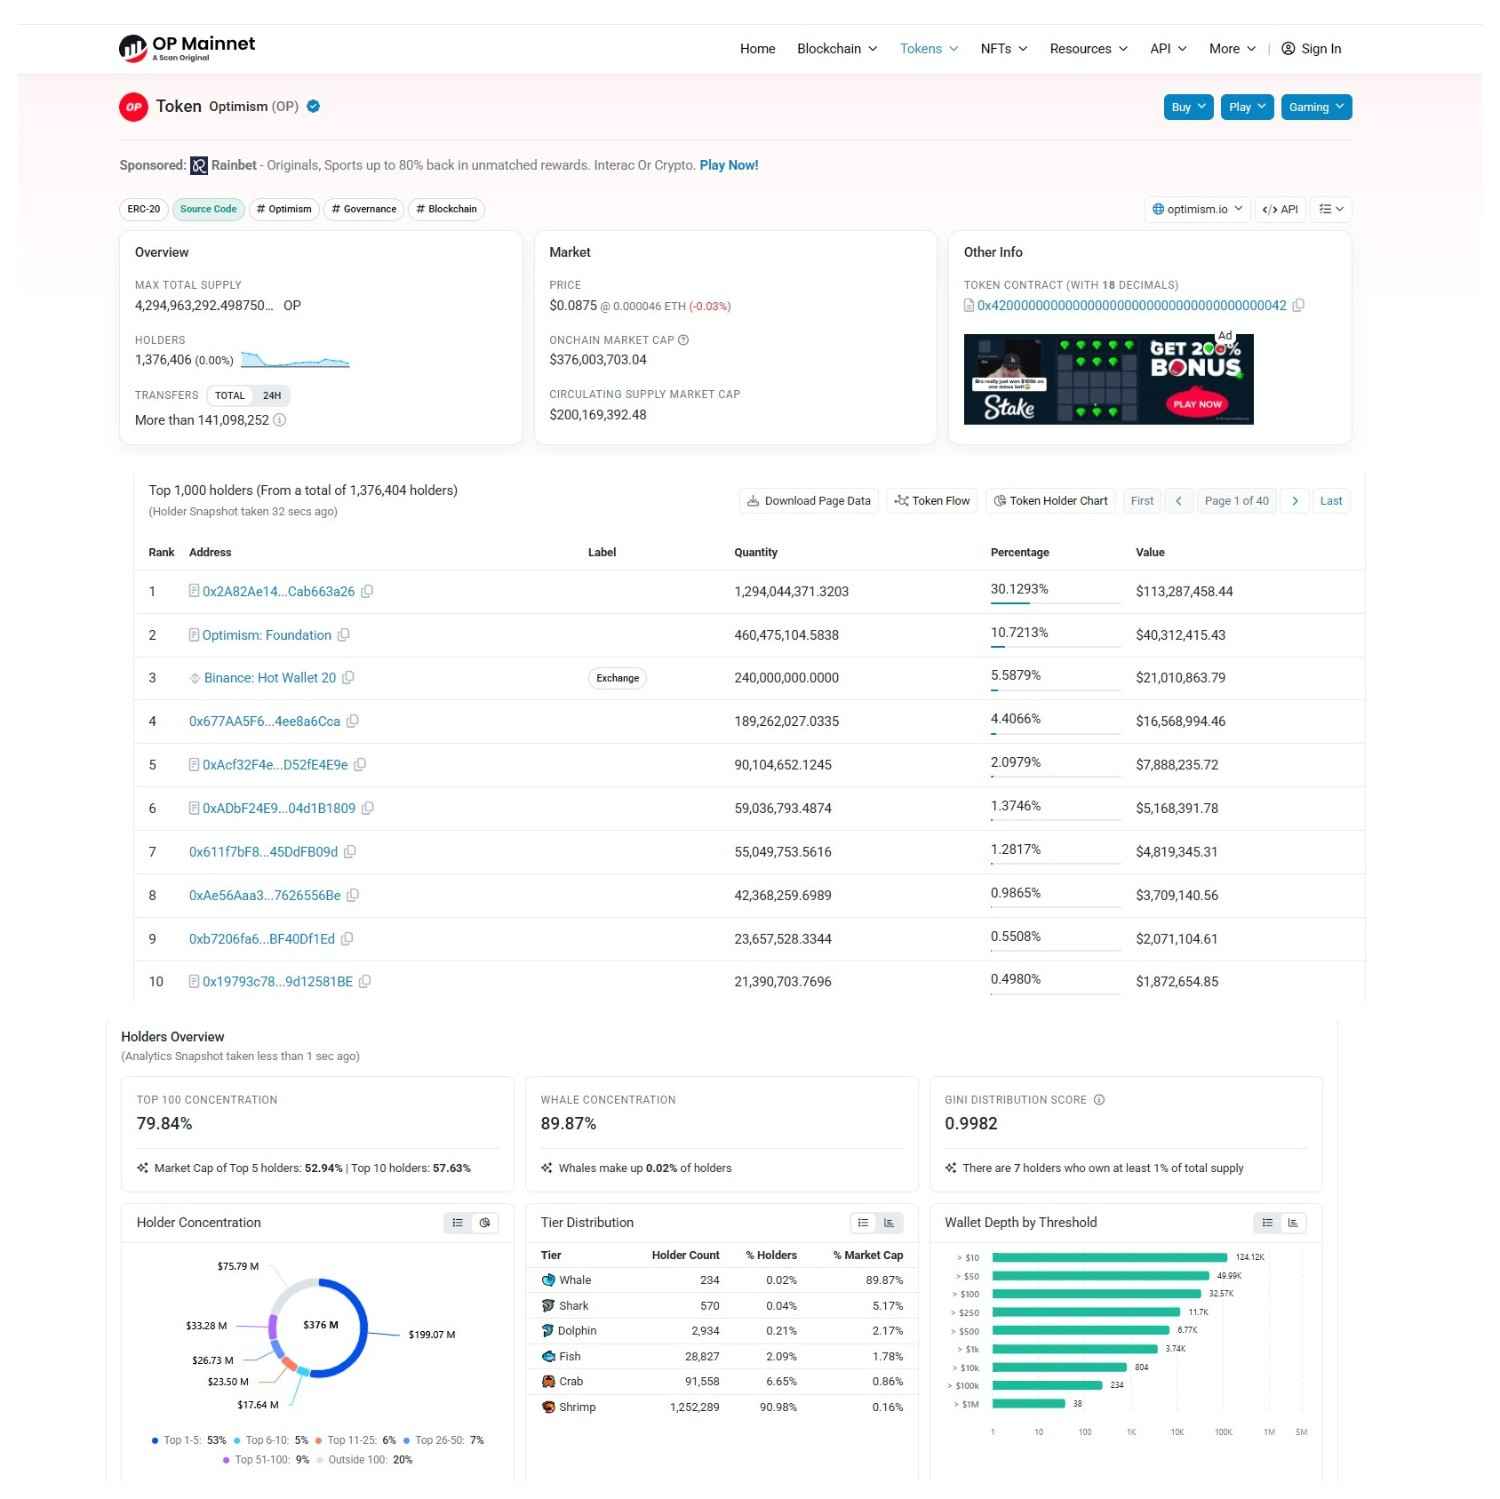
On optimistic.etherscan.io, holder count sits at 1.37M, with over 141M total transfers. But concentration is steep: the top 100 wallets hold 79.84% of supply, and just 234 whale wallets, 0.02% of all holders, control 89.87% of market cap. The Gini score reads 0.9982, about as concentrated as it gets.
Liquidity and Derivatives Risk
Per CoinGlass , 24-hour liquidations hit $132.16K, with longs taking the bigger hit at $116.40K against $15.76K in shorts. Volume runs mostly through Binance at $22.84M, ahead of Bybit and LBank. Thin liquidity like this can exaggerate moves in either direction.
Long-Term Outlook: 2027 to 2030
A longer-term optimism price prediction 2026 and beyond stays tied to broader Ethereum L2 competition, from Arbitrum and Base to zkSync and Scroll, much like the setup in this ethereum price prediction 2026. A sustained breakout could reopen the $0.15-$0.18 zone over time, but that needs real institutional adoption, not just an announcement.
Should You Buy Optimism Now or Wait?
That depends on risk tolerance. This setup mixes a fresh institutional push with a chart still printing fresh lows. This is market analysis, not personal financial advice.
Risks That Could Change This Forecast
Ethereum weakness tops the list; OP rarely decouples. Heavy whale concentration adds volatility risk. A failed channel breakout, or thin OP Enterprise adoption, would undercut the bullish case fastest. Check the coin events calendar for scheduled unlocks before treating any single month as settled.
Methodology: Chart levels from OP/USD daily and weekly charts on OKX via TradingView, RSI-14, and 20-period Bollinger Bands, captured July 30, 2026, at 13:22 UTC. Market cap and supply data from CoinMarketCap. Liquidation and volume data from CoinGlass.
Disclaimer: This is speculative market commentary, not financial advice. Crypto assets are volatile. Verify live figures before trading.
0
0


 Manage all your crypto, NFT and DeFi from one place
Securely connect the portfolio you’re using to start.

0
0


0
0

0
0