
Epic Chain crypto surges 47% above its average, RSI hits 77

1
0

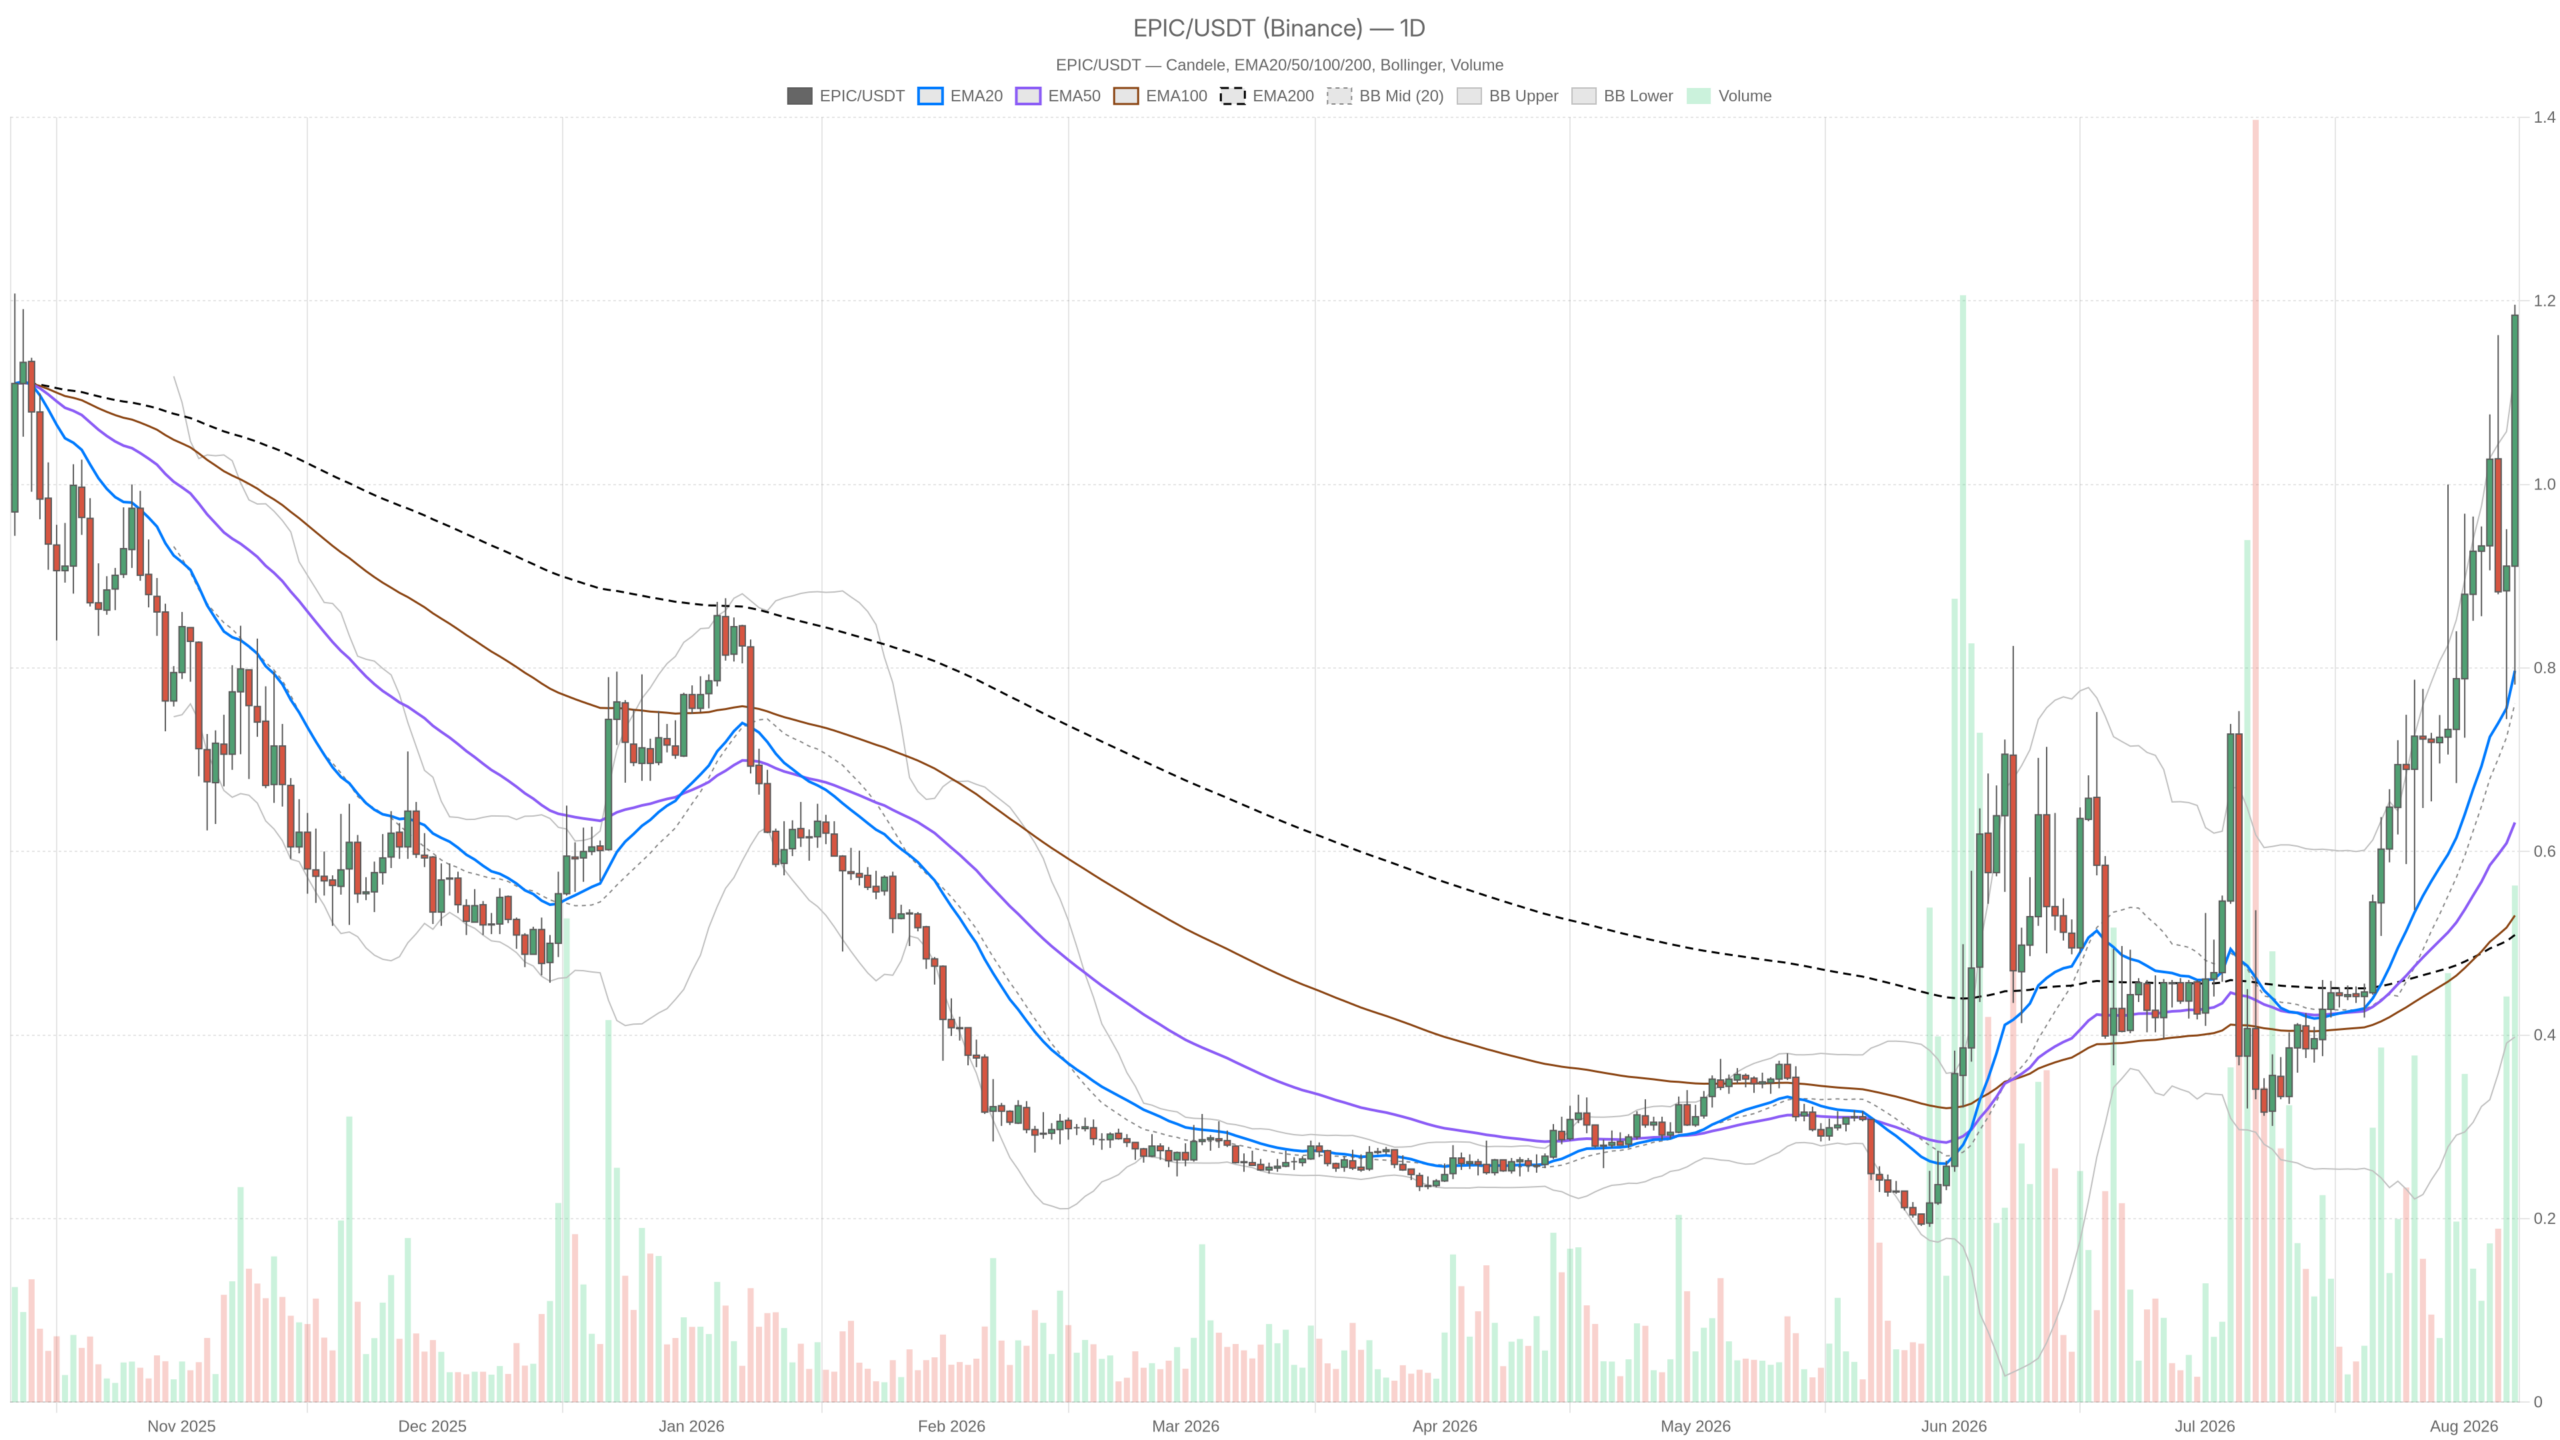
As of August 7, 2026, EPICUSDT trades at 1.18 against USDT. The daily chart reflects a repricing event for Epic Chain crypto, with the 20-day EMA sitting at 0.80 and spot closing outside the upper Bollinger Band at 1.12.
Key takeaways
- EPICUSDT trades at 1.18, roughly 47% above its 20-day EMA of 0.80
- Daily RSI(14) stands at 77.47, deep in overbought territory
- Daily ATR of 0.19 means a one-day adverse move drags price to approximately 0.99
- BTC dominance is 56.78% and the Fear & Greed Index reads 29
- Pivot point rests at 1.05, with R1 at 1.33 and S1 at 0.91
Why the Daily Bias Is Bullish — But Structurally Stretched
The daily regime is unambiguously bullish. MACD on D1 shows the line at 0.14 above the 0.11 signal, with a positive histogram of 0.03. Momentum is still expanding, not rolling over. Price sits above all three EMAs in correct sequence, and MACD continues to accelerate. The trend template remains intact. If you are looking for a reason to be short, momentum is not providing one yet.
The problem, however, is the price of admission. RSI(14) at 77.47 on the daily signals the move is running hot. In a genuine impulse, overbought readings can persist for weeks. Yet they also mean every new long enters thin air rather than value. The Bollinger picture is even clearer: mid-band at 0.76, upper at 1.12, lower at 0.40. With price at 1.18, the band is no longer containing the move.
Volatility has exploded and the distribution has broken. Historically, closes beyond the upper band resolve in one of two ways. Either a sideways shelf lets the bands catch up, or a violent snapback targets the mid-band. Neither outcome supports a trend continuation trade at current levels. Moreover, ATR(14) on the daily is 0.19 — roughly 16% of spot. That single number should reframe how anyone sizes exposure here.
A one-ATR adverse day drags price to approximately 0.99. A two-ATR flush puts it at 0.80, which is exactly where the 20-day EMA sits waiting. In other words, a completely ordinary volatility event in this asset would look catastrophic on a normal chart. It would still leave the daily uptrend technically alive. The risk is not that the trend breaks. The risk is how much room exists before it does.
Pivots: The Map That Actually Matters
Daily pivots offer the cleanest framing: pivot point at 1.05, R1 at 1.33, S1 at 0.91. Price trades well above the pivot, confirming who controls the higher timeframe. R1 at 1.33 is the logical magnet if the squeeze gets a second leg. Notably, it sits above the upper Bollinger Band. A push there would require even more volatility expansion, not less. On the downside, 1.05 marks the first line where the bullish case stops being obvious.
A loss of 0.91 would need serious defending. That level would put price back inside the old consolidation range and below the pivot structure entirely. The moving averages — 20-day at 0.80, 50-day at 0.63, 200-day at 0.51 — form a perfectly stacked bullish foundation. But the spot price at 1.18 has left them far behind. The structure argues for continuation, yet the distance from value argues for caution.
The Hourly Chart Confirms the Trend but Warns About Momentum
On H1, the structure still supports the bulls. EMA20 at 1.04, EMA50 at 0.98, and EMA200 at 0.90 all sit beneath the 1.18 print. The hourly MACD line at 0.07 versus the 0.05 signal, with a 0.02 histogram, keeps the short-term impulse positive. However, RSI has cooled to 65.93 — strong but not euphoric. That gap between a 77 daily RSI and a 66 hourly RSI reveals a move that has stopped accelerating on the lower timeframe.
The daily still carries the memory of the spike. The hourly pivot cluster is unusually tight: PP at 1.17, R1 at 1.20, S1 at 1.16. Compressed pivots plus an hourly ATR of 0.10 signal that the market has shifted from expansion into balance right at the highs. Balance at the top of a vertical move creates an interesting tension. It either resolves upward through 1.20 toward the hourly band top at 1.26, or it fails and turns into distribution.
The hourly mid-band at 1.00 and the EMA20 at 1.04 are the levels that would confirm the second outcome. These represent the structural floor beneath the current consolidation. A break below them would shift short-term control away from buyers. Until then, the hourly trend remains technically intact, even as momentum fades.
15 Minutes: Execution Context, First Sign of Fatigue
The 15-minute chart is where the stall shows most honestly. EMAs remain stacked at 1.13, 1.08, 0.98 and RSI is 64.03. But MACD has flattened completely — line 0.03, signal 0.03, histogram 0.00. Momentum on the execution timeframe is neutral. Price is pinned at 1.18, which is also the 15-minute pivot, with R1 at 1.19 and S1 at 1.18. This is a coiled, decision-point structure with a micro ATR of just 0.03.
This is not a chart to chase into. It is a chart to react to. Losing the 15-minute mid-band at 1.12 would mark the first real crack. A slide under 1.08 would hand short-term control back to sellers. So do the timeframes agree? Directionally yes, but energetically no. The daily shows a powerful uptrend that is dangerously extended. The hourly shows an intact but decelerating structure. The 15-minute chart shows buyers have paused.
That paints a coherent picture of a market digesting a spike. It does not suggest a market preparing another vertical leg by default. The compression at the highs can resolve either way. What matters now is which level breaks first — 1.20 on the upside or 1.12 on the downside. Until then, the chart offers tension without commitment, and that environment punishes impulsive entries.
Two Scenarios for EPICUSDT, and What Kills Each One
The bullish path requires the current compression to hold. If EPICUSDT keeps building above the 1.16–1.17 zone and pushes decisively through hourly R1 at 1.20, the path opens toward 1.26 — the hourly band top — and then daily R1 at 1.33. For this to be credible, the 15-minute MACD must turn positive again rather than drift. Moreover, pullbacks must stay shallow, with no closes back under 1.12.
What invalidates the bullish scenario: an hourly close below 1.04, which would break the short-term EMA structure. Likewise, any daily close back inside the Bollinger range with a loss of 1.05 ends the squeeze. This holds true regardless of how bullish the moving average stack still looks. The broader market context adds weight here. According to CoinGecko, total crypto market capitalization stands at roughly $2.296 trillion. Yet the Fear & Greed Index reads 29 and BTC dominance is near 57%, leaving little risk appetite to catch a falling alt.
The bearish path does not need the trend to die. It only requires gravity to work. With RSI near 77 and price above the upper band, the mean-reversion trade targets the 1.05 pivot first, then 0.91 at S1. The 20-day EMA at 0.80 acts as the deeper magnet if a single ATR-sized day turns into two. This scenario gains real weight if volumes fade while price stays flat or if the broader tape deteriorates further.
What invalidates the bearish case: acceptance above 1.20 on rising participation. A shallow dip that holds the 1.12–1.16 zone and immediately reclaims the highs would also negate it. Trend-followers retain the benefit of the doubt as long as the daily MACD histogram stays positive. That said, the margin for error is thin. The distance from current price to structural support is far greater than the distance to the next resistance shelf.
Positioning Around a Squeeze, Not a Trend
Context from the broader market argues for humility. DefiLlama fee data shows the on-chain trading engine cooling rather than heating. Uniswap V3 fees are down 20.56% on the day and 21.08% over the week. Uniswap V4 is down 21.85% weekly, and Curve is down 26.8%. Rotation is happening in pockets — Ekubo fees jumped 112.33% in a day and 78.78% on the week. This is exactly the kind of narrow, fast-moving flow environment that produces charts like this.
Money is not broadly bidding risk. It is sprinting between a handful of venues and tickers. Practically, that means the asymmetry at 1.18 is unattractive for fresh trend entries. The distance back to structural support — 1.05, then 0.91 — is enormous relative to the distance to the next resistance shelf. A 0.19 daily ATR means stops placed just below any level will get taken out by noise.
The more defensible posture is patience: either wait for the hourly compression to resolve with confirmation above 1.20, or wait for a controlled retest of the 1.05–1.12 zone. That approach lets you define risk against real levels instead of against a band the price has already broken. None of this is a prediction. The honest read is that the signals conflict: the structure is bullish and momentum is fine, but valuation-within-the-trend is stretched and the macro mood is fearful.
Squeezes end without warning and without a lower high to tip you off. Whoever is holding Epic Chain crypto exposure here is holding a volatility position more than a directional one. The only variable fully under a trader’s control is size. In an environment where daily ATR sits at 16% of spot and the broad market registers Fear, capital preservation should rank ahead of conviction.
FAQ
What is driving Epic Chain crypto’s price action?
The move appears flow-driven and isolated. Total crypto market capitalization is roughly $2.296 trillion with Bitcoin dominance at 56.78%, suggesting capital remains defensive. The Fear & Greed Index at 29 confirms broad risk aversion. EPICUSDT is rallying against this backdrop, which points to specific buyer demand rather than a rising market tide.
How overbought is EPICUSDT right now?
Daily RSI(14) sits at 77.47, firmly in overbought territory. Price at 1.18 has closed outside the upper Bollinger Band at 1.12, and spot trades approximately 47% above its 20-day EMA of 0.80. While overbought readings can persist in strong trends, the distance from mean value is unusually wide.
What are the key levels to watch?
The pivot point at 1.05 serves as the first structural support, followed by S1 at 0.91 and the 20-day EMA at 0.80. On the upside, hourly R1 at 1.20 is the immediate resistance to clear, with 1.26 at the hourly Bollinger band top and daily R1 at 1.33 as further targets.
Disclaimer: This article is for informational purposes only and does not constitute financial advice, an investment recommendation, or a solicitation to buy or sell any financial instrument or cryptocurrency. The analysis provided is not indicative of future results. Investing in crypto assets and financial markets carries a high risk of capital loss. Always do your own research (DYOR) and consult a qualified financial advisor before making any decision.
Article produced with the assistance of artificial intelligence and reviewed by the editorial team.
1
0


 すべての暗号通貨、NFT、DeFiを1か所から管理
開始に使用しているポートフォリオを安全に接続します。


