
Jito Price Prediction: $JTO Rally, New JTX Launch, More Upside Ahead?

0
0

There's a new product out of the Jito camp, and the chart happens to be cooperating at the same time.
Jito runs liquid staking and MEV infrastructure for Solana, the kind of plumbing most Solana users interact with without ever knowing it.
This Jito Price Prediction walks through what the new launch means and where the price stands against the level that's tripped it up before. There's one number worth watching closely here.
JTO Price Prediction Market Overview
| Metric | Value |
| Current Price | $0.6332 |
| 7 Day Change | +2.8% |
| 24h Range | $0.5976 - $0.6409 |
| Market Cap | $317.997M |
| Outstanding Token Value | $459.85M |
| Fully Diluted Valuation | $634.45M |
| 24h Trading Volume | $34.639M |
| Total Value Locked (TVL) | $776.029M |
| Circulating Supply | 501.216M JTO |
| Outstanding Supply | 725.484M $JTO |
| Total Supply | 1B $JTO |
Source: Data from CoinGecko. TVL, or Total Value Locked, is the dollar value of assets deposited into Jito's staking and DeFi contracts.
Jito news today: Jito Launches JTX Trading Platform
Jito rolled out JTX this week, a self-custodial trading platform from Jito Labs , meaning users trade directly from their own wallets rather than depositing funds with an exchange, covering both Solana tokens and real-world assets.
The Block reported this launch independently of Jito's own channels, which supports treating it as a confirmed development rather than an unverified claim from a single account.
Source: Data From X
Adding real-world assets alongside Solana tokens expands what JTX can be used for beyond crypto-native trading. This gives Jito a second product line next to its existing staking and MEV infrastructure business, though it is too early to measure what usage or revenue this adds; no adoption figures have been published yet.
JTO price prediction 2026: JTO Price Chart Analysis
JTO has traded inside a descending channel since late June, down from a high near $0.85. In early July, the price broke above the channel near $0.7921.
That breakout did not sustain, and the price returned inside the channel and continued trading in the channel.
This is relevant because a failed breakout at a level raises the bar for what counts as confirmation the next time price approaches it.
JTO bottomed in the $0.5408 level and has since recovered to $0.6332, up 1.57% on the latest 4H candle. EMA 9 is at $0.6216 and EMA 20 is at $0.6074, both below the current price, meaning short-term momentum is positive on this timeframe. If the price sustains, then the levels are mentioned below. 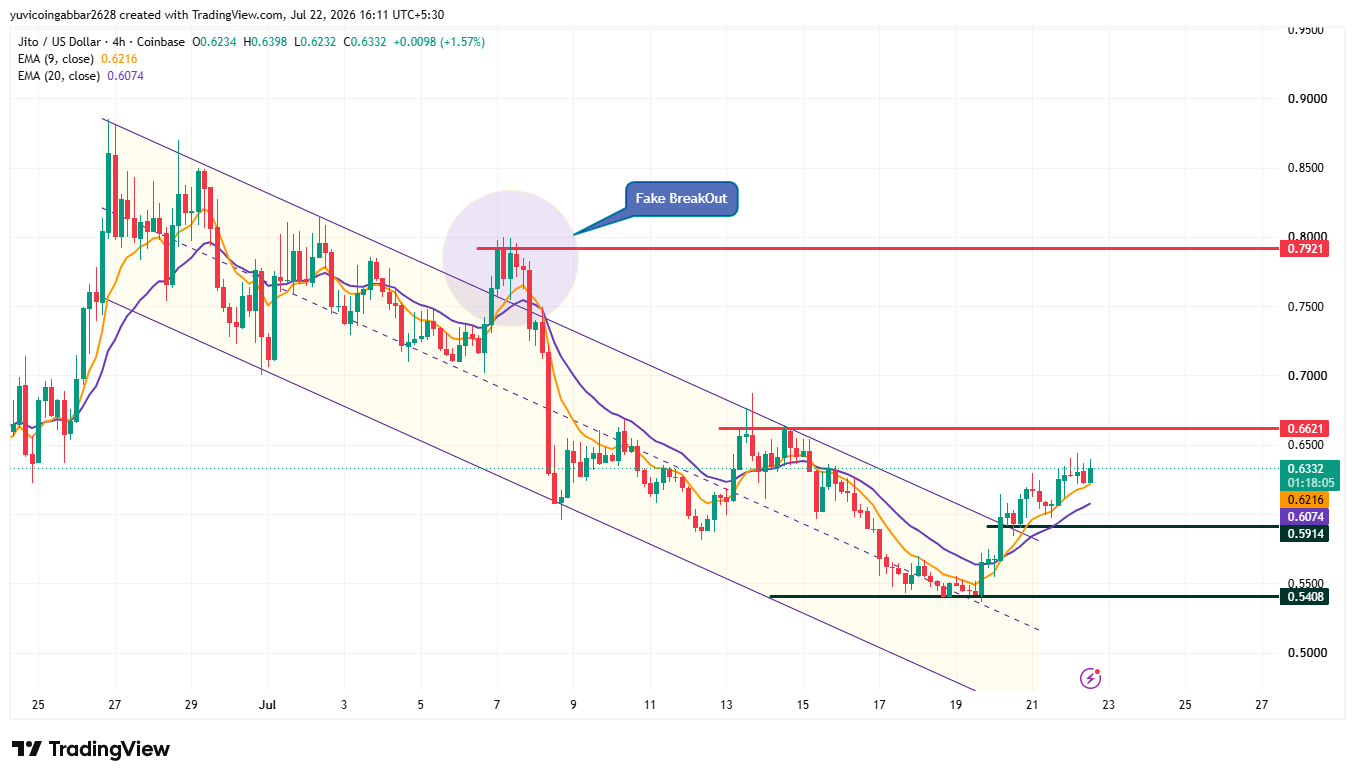
| Level Type | Price |
| Resistance (prior failed breakout) | $0.7921 |
| Resistance (next test) | $0.6621 |
| EMA 9 | $0.6216 |
| EMA 20 | $0.6074 |
| Current Price | $0.6332 |
| Support | $0.5914 |
| Second Support | $0.5408 |
Price Scenarios and Invalidation Levels
| Scenario | Target | Trigger | Timeframe | Invalidation |
| Bullish | $0.7921 | Daily close above $0.6621 on rising volume | 1-3 weeks | Close back below $0.6621 after the breakout |
| Base | $0.6621 test, range-bound | The price holds between $0.5914 and $0.6621 | Days to 2 weeks | N/A, this is the default case absent a confirmed break |
| Bearish | $0.5408 | Daily close below $0.5914 | 1-2 weeks | Close back above $0.5914 |
These are scenario outlines based on the chart structure above, not guaranteed outcomes. Volume and RSI confirmation, when available, should be checked against these levels before acting on them.
What This Means for Different Readers
Existing holders have $0.5914 as the level that keeps the current recovery structure intact. A daily close below it would undercut the base case above.
For anyone evaluating a position, the earlier failed breakout at $0.7921 is a relevant data point; the price has approached resistance and reversed at least once already in this same range.
A confirmed close above $0.6621, ideally with volume data confirming it, would carry more weight than the price simply touching that level intraday.
Jito Market Outlook and Expert View
According to CoinGabbar analysts, the bullish case depends on JTO clearing $0.6621 with a daily close, which would put the $0.7921 zone back in range, supported by the new JTX product line, though its actual usage impact on JTO demand has not yet been measured. The bearish case activates on a daily close below $0.5914, which would put the $0.5408 low back in play. Given the failed breakout earlier in this same move, a confirmed close carries more weight here than an intraday touch of resistance.
Glossary: An EMA (Exponential Moving Average) weights recent prices more heavily than older price data. RSI (Relative Strength Index) measures the speed of recent price moves to flag overbought or oversold conditions. TVL (Total Value Locked) is the dollar value of assets deposited into a protocol's contracts.
Analyst note: Chart levels were drawn by CoinGabbar analyst using TradingView, JITO/USD, and Coinbase spot data on July 22, 2026. RSI and volume confirmation were not available at the time of writing and should be checked independently before using these levels.
Two structural notes for this piece: the disclaimer sits as a plain paragraph with no heading, and internal links are trimmed to two that point to genuinely distinct pages rather than overlapping prediction content to avoid the cannibalization issue flagged in the audit.
Disclaimer: This article is for informational purposes only and should not be treated as financial advice. Cryptocurrency markets are highly volatile and carry significant risk.
0
0


 Manage all your crypto, NFT and DeFi from one place
Securely connect the portfolio you’re using to start.

0
0

0
0

0
0
