
Will It Really Be an Uptober for Bitcoin?

0
0

Bitcoin is trading at $84,022 following a bearish start to the week. The asset dropped below $83,000 on Monday, although a previous outlook suggested that the decline was not concerning.
The analysis noted that despite the decline, Bitcoin “remains within the same broader trading zone as last week.” That remains the case at the time of writing, with the apex coin yet to break out of its current range.
On the 1-week chart, BTC is printing a doji as trading volume remains relatively subdued. However, last week’s surge was notable, leaving traders wondering what fueled the move. Following the almost 7% gain last Monday, the apex coin has failed to register another significant upside move.
It remains to be seen how the rest of the week will play out. September also ends on Wednesday, and speculation about what October could bring is already emerging across social media.
BTC Slowed Down in September
Going into the month, one analysis suggested that September would help answer the critical question of whether the bear market was over. It identified $79,000 as a key level to watch, arguing that if Bitcoin held above the mark throughout the month, it would signal that the bear market was over.
With BTC currently trading above that level, the asset has so far maintained the threshold highlighted in the analysis.
There were several notable developments during the 30-day period, but one of the freshest remains the FOMC meeting. Traders expected a rate hike and a subsequent decline in Bitcoin’s price. They got both: the Fed raised rates, while the apex coin retraced ahead of the announcement.
Interestingly, improving fundamentals became a catalyst for the uptrend during the second half of the month. BTC subsequently surged above its eight-month high and peaked at $87,000.
Despite reaching that milestone, however, Bitcoin’s momentum slowed toward the end of September. Based on current valuations, the asset could close the month with gains of more than 7%. Comparing that performance with August shows that the upward momentum may be fading.
Amid the slowdown, Bitcoin is heading toward its best-performing Q3 in eight years. It could also mark its third consecutive month of gains for the first time in more than a year.
While September provided evidence that the bear market may be over, price action over the past 28 days suggests that Bitcoin may not immediately experience another massive uptrend in October.
Is Bitcoin Still on Course for Uptober?
Beyond the recent slowdown, another factor worth considering is Bitcoin’s historical performance in October. The monthly return heatmap shows that October is the third-most profitable month of the year, with the apex coin recording an average return of around 13%. Additionally, since 2011, October has ended in losses only five times.
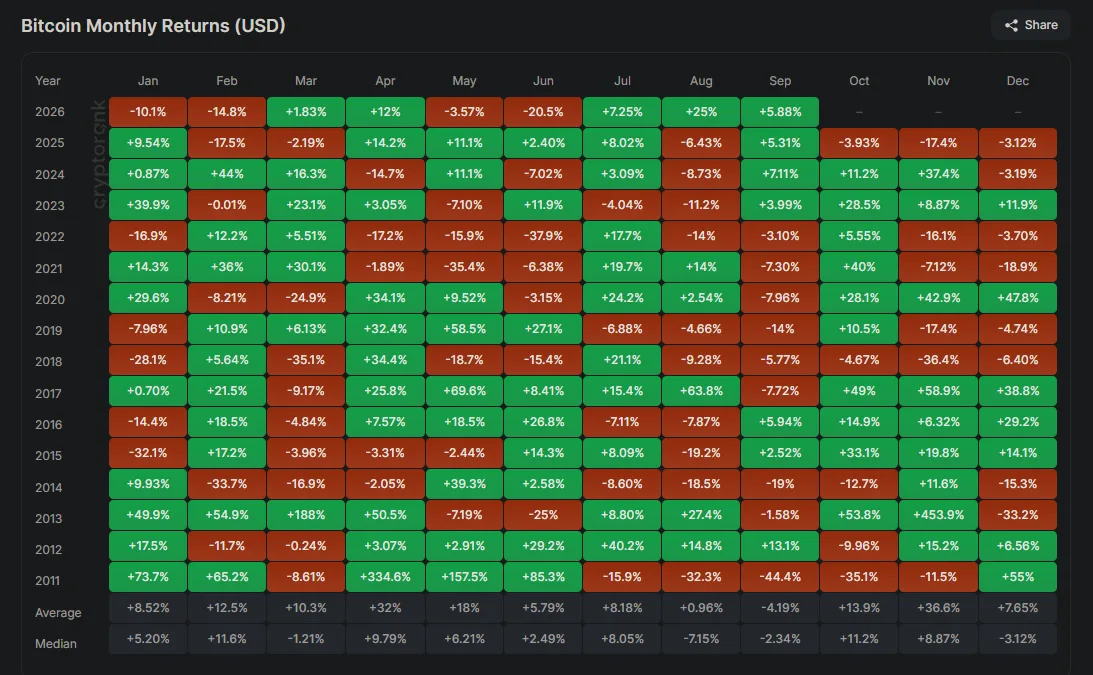
These historical trends explain why many investors expect further gains in October. However, a closer look at the heatmap reveals another pattern that deserves attention.
In several instances, October recorded notable gains after September ended in losses. This makes the current setup different from some of Bitcoin’s strongest October performances.
There is, however, an exception. In 2012, Bitcoin closed September with notable gains before retracing in October. That occurred after a three-month uptrend, making the historical setup somewhat similar to the current one as Bitcoin approaches another potentially strong Q3.
Taken together, two factors could challenge the traditional Uptober narrative: slowing momentum and the historical behavior of Bitcoin following extended periods of gains.
Interestingly, the monthly return heatmap can also be interpreted as evidence supporting another advance. Therefore, historical data alone does not provide a definitive direction for October. However, when combined with current market conditions and technical indicators, it raises the possibility of a weaker start to the month.
The chart provides another reason to remain cautious. On the 1-day chart, BTC has remained rangebound for almost seven days, making its inability to break out increasingly important.
Investors also appear to be becoming more cautious about Bitcoin’s next move. Bitfinex BTC Longs have gradually declined, with the drop beginning around September 23 and coinciding with a roughly 2% decline in Bitcoin’s price.
Additionally, there is little evidence of strong buying pressure at the time of writing. Recent CryptoQuant data shows exchange reserves rising. While higher exchange reserves do not necessarily mean traders are preparing for a major selloff, they can increase the amount of Bitcoin potentially available for sale.
Bitcoin Close to a Bearish Divergence
On the 1-day chart, the Moving Average Convergence Divergence (MACD) indicator suggests that Bitcoin could face downward pressure in the first half of October. The indicator is approaching a bearish crossover, signaling that bullish momentum may be weakening.
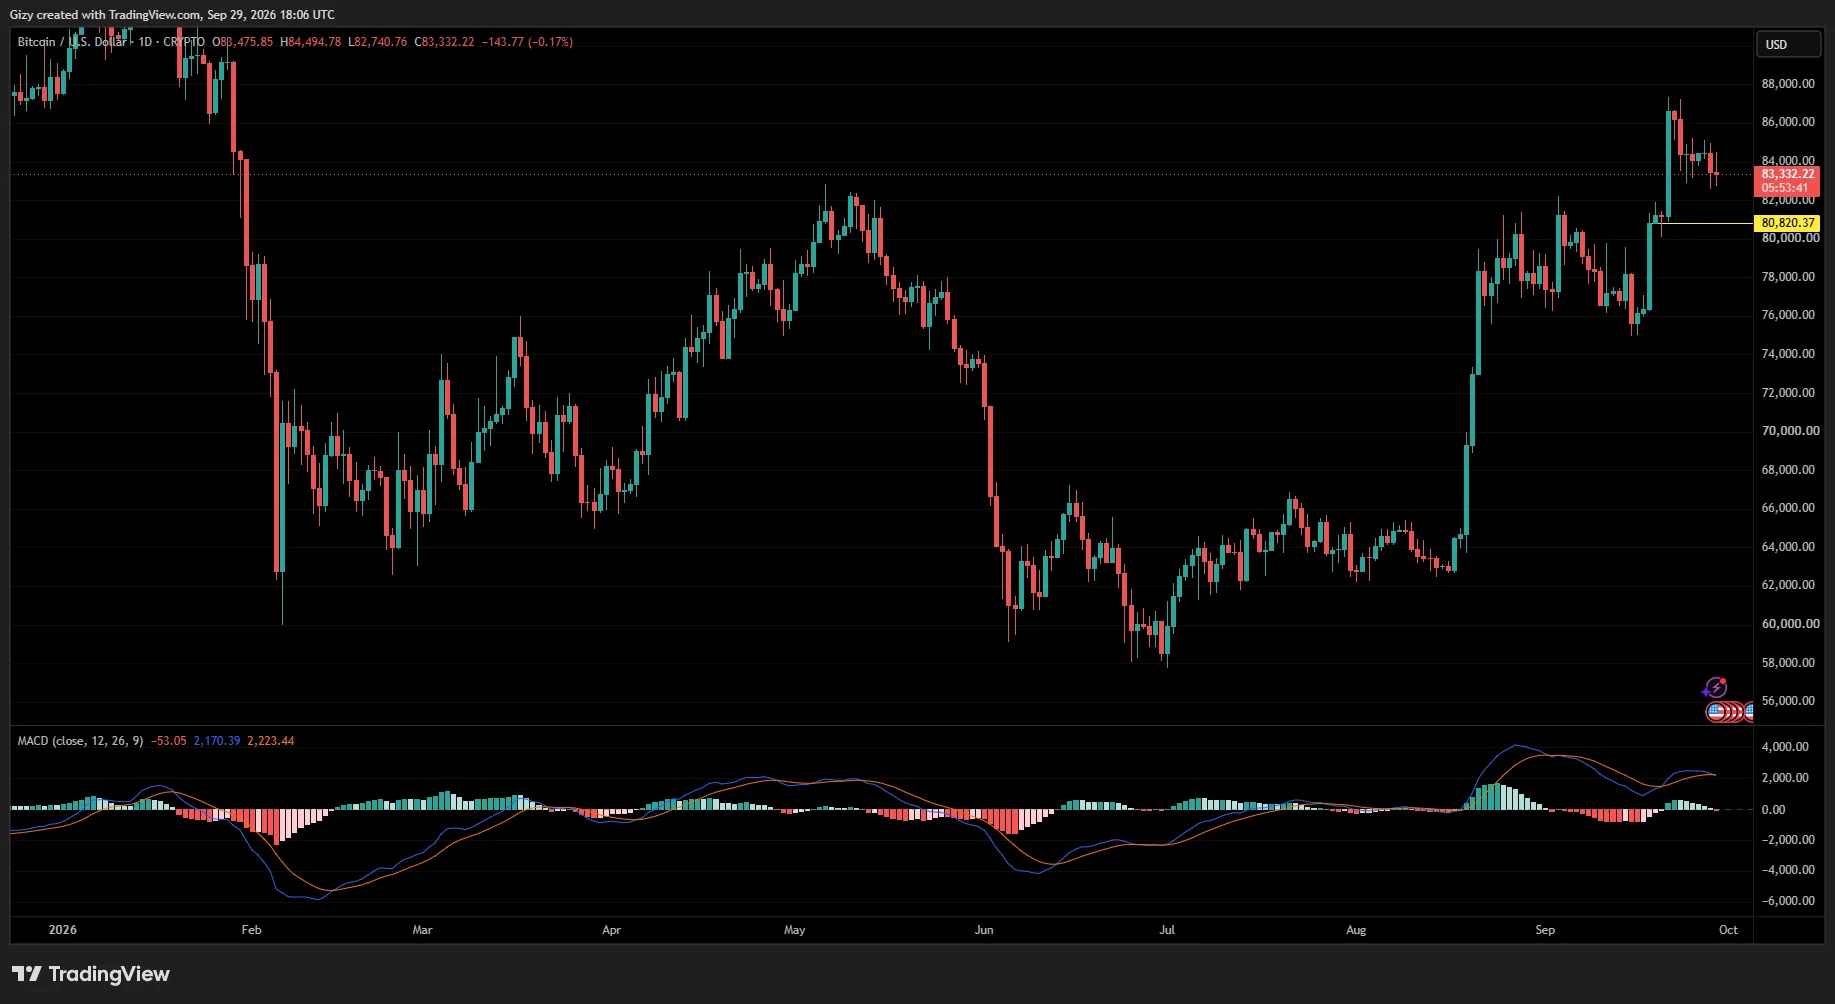
The last time the MACD displayed a similar signal, BTC retraced by more than 6% before recovering. If a similar move occurs this time, Bitcoin could fall below $80,000.
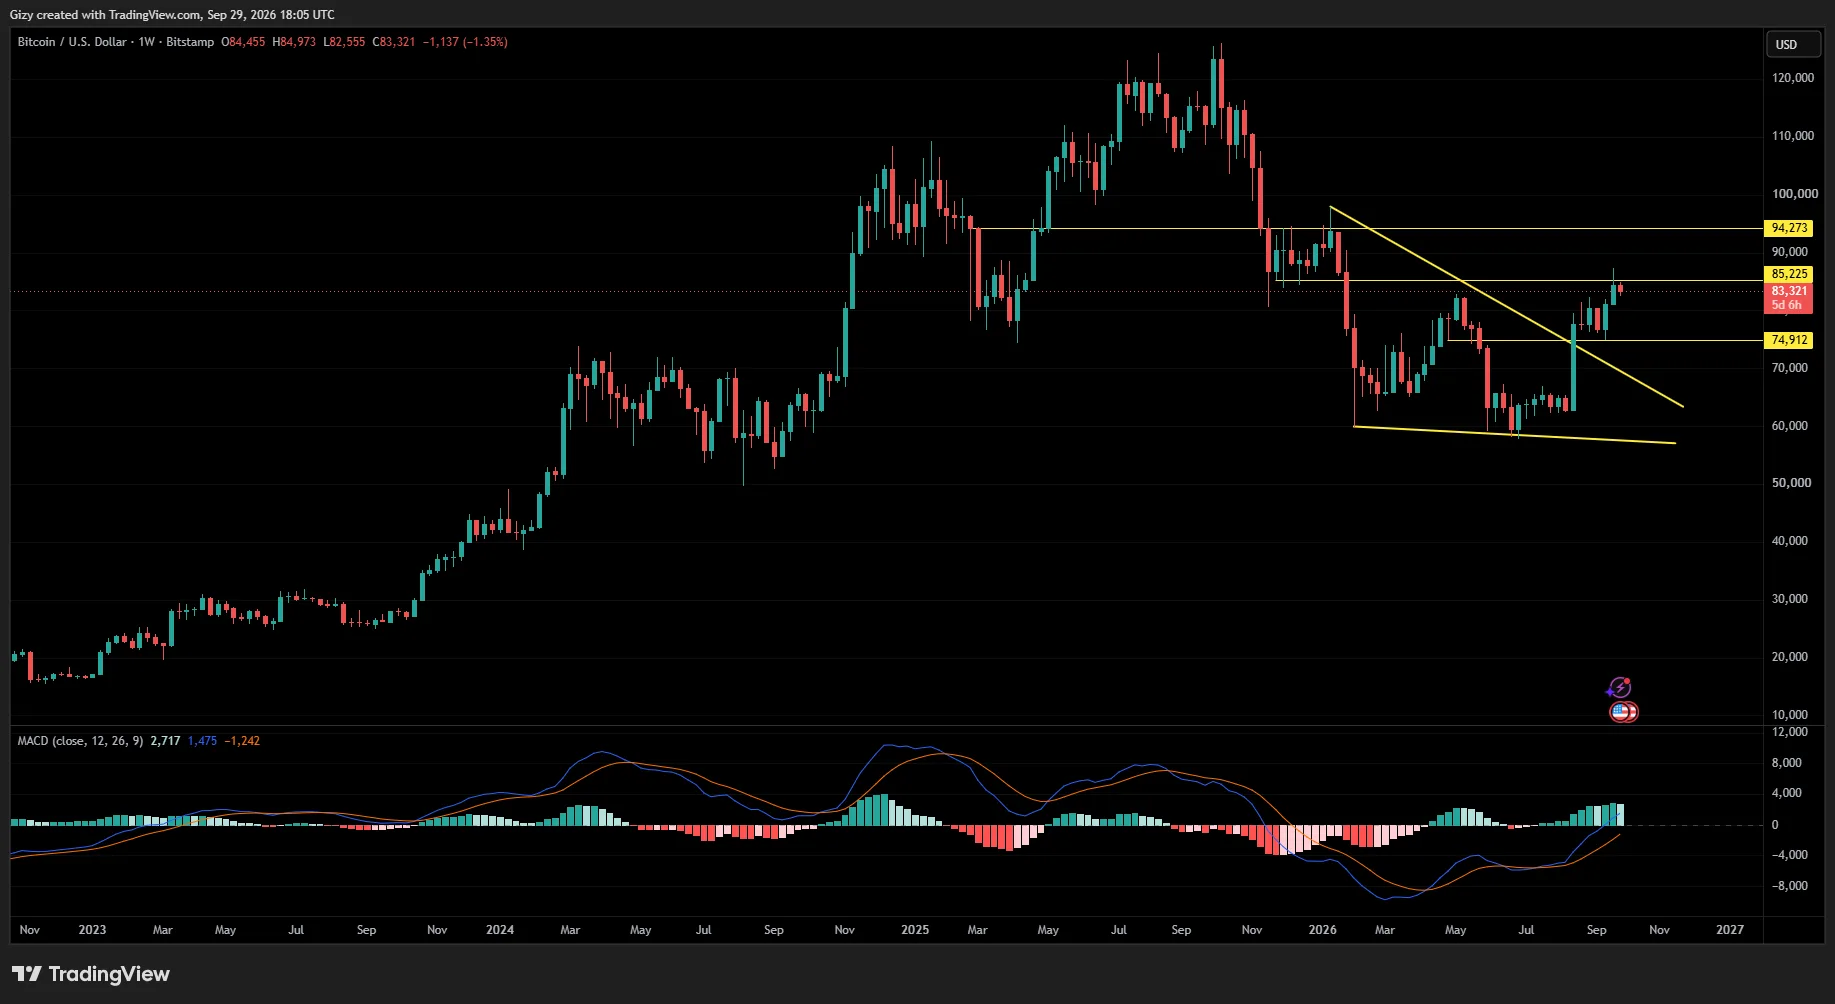
On the 1-week chart, Bitcoin has also failed to maintain trading above $85,000. Looking at previous price action, the level previously acted as strong support, with BTC trading between $85,000 and $94,000.
Following its recent rejection at $85,000, the apex coin remains locked in the broader $85,000-$74,000 range. A break below the $80,000 support could therefore expose Bitcoin to another test of $74,000.
In a nutshell, Bitcoin’s inability to break into the upper zone is keeping the $74,000 level relevant. A sustained move below $80,000 could increase the likelihood of a deeper retracement toward that support.
For now, the traditional Uptober narrative is facing several challenges. Slowing momentum, cautious positioning, rising exchange reserves, and bearish signals on the daily chart suggest that Bitcoin could experience a pullback during the first half of October.
However, this does not necessarily rule out an eventual October rally. If the bulls regain control and push Bitcoin back into the $85,000-$94,000 channel, the apex coin could attempt to retest $90,000 for the first time in nine months.
For now, the key levels to watch are $80,000 on the downside and $85,000 on the upside.
The post Will It Really Be an Uptober for Bitcoin? appeared first on CoinTab News.
0
0

 Manage all your crypto, NFT and DeFi from one place
Securely connect the portfolio you’re using to start.


