
Uniswap Price Prediction: $UNI Breakout Could Spark the Next Rally

0
0

Uniswap has been one of the more closely watched DeFi tokens all year, and this week it's back in the spotlight. This Uniswap price prediction looks at where the token stands after a strong daily move and what's shaping the next few days.
Current Price Snapshot
UNI trades at $3.69 , up 6.9% over 24 hours, ranging between $3.44 and $3.74.
Market cap is $2.305B on a circulating supply of 625.344M tokens; fully diluted valuation, at the 1B max supply, is $3.29B. 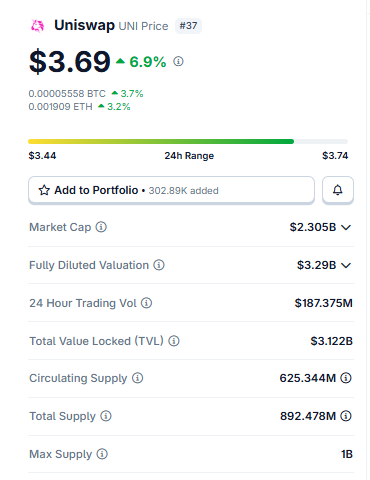
Source: Data From Coingecko.
TVL reads $3.122B, and 24-hour volume hit $187.375M. With a total supply at 892.478M, roughly 267M UNI still sits outside circulation, a separate, longer-horizon overhang worth noting.
Liquidation Data: Shorts Have Been Paying for This Move
Liquidations over 24 hours totaled $155.89K, with shorts at $141.50K against just $14.39K in longs, visible across the liquidation heatmap: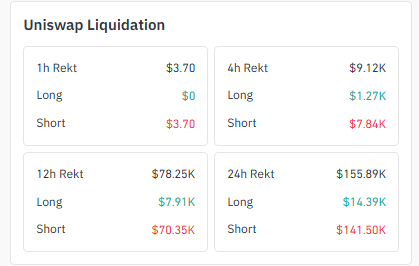
| Timeframe | Total Liquidations | Longs | Shorts |
|---|---|---|---|
| 1h | $3.70 | ~$0 | $3.70 |
| 4h | $9.12K | $1.27K | $7.84K |
| 12h | $78.25K | $7.91K | $70.35K |
| 24h | $155.89K | $14.39K | $141.50K |
Shorts got caught on the wrong side as the price broke the trendline, forcing covers that added to the move. Supportive of the bullish case, not proof of it.
Exchange Volume and the Burn Vote
Binance leads exchange volume at $71.33M, ahead of WhiteBIT ($43.38M) and OKX ($36.17M), with Bybit, BingX, LBank, Gate, MEXC, and Bitget filling smaller slices.
Source: Volume Heatmap Data Taken From Coinglass.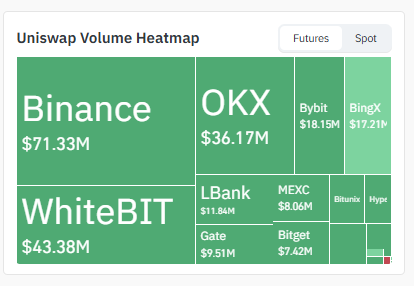
The Binance/OKX concentration suggests some institutional participation rather than pure retail flow.
Social Sentiment: A Live Vote to Burn UNI
Separately, Uniswap is voting on a proposal to expand protocol fees and increase UNI burns, closing in five days (Source: MSB Intel on X).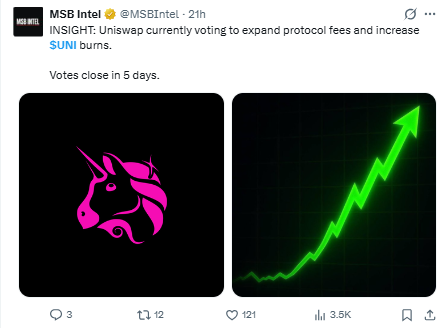
A pass would mean more protocol revenue converted into permanently removed UNI, a deflationary mechanic landing in the same window both charts are set to resolve in, with technical and fundamental triggers overlapping rather than acting alone.
Holder Concentration
The top 100 wallets control 82.15% of supply, and whale-tier wallets ($1M+) hold 96.33% of market cap across 855 addresses (Source: on-chain snapshot). Gini score: 0.9976.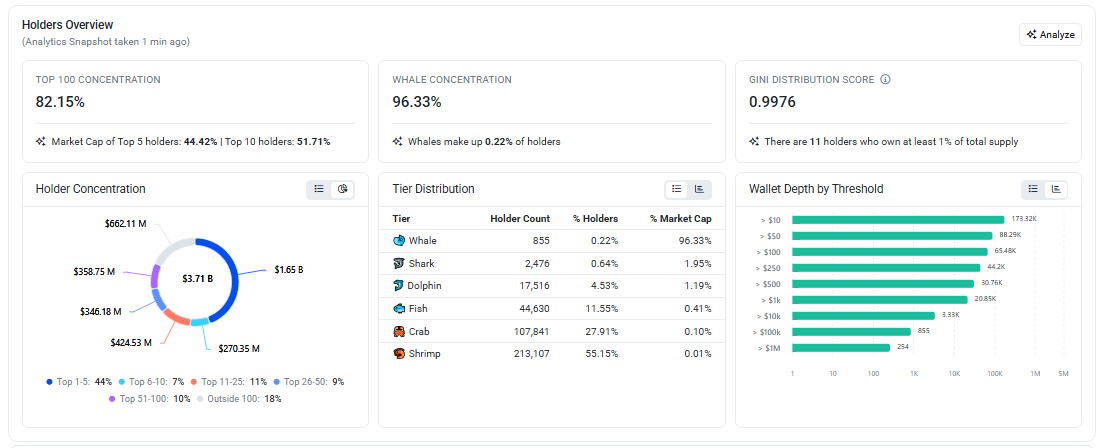 The top 5 wallets alone hold 44.42%. This concentration means large wallet activity, including anything tied to the vote, can move the price outside pure chart flow.
4H Chart: Trendline Broken, Now Comes the Retest
UNI had been sliding along a falling trendline for weeks, and price broke above it this session, printing a high of $3.741 before easing to $3.694 (O: $3.726, H: $3.741, L: $3.684, C: $3.694, -0.83%)
Source: Chart From TradingView, UNI/USDT 4H 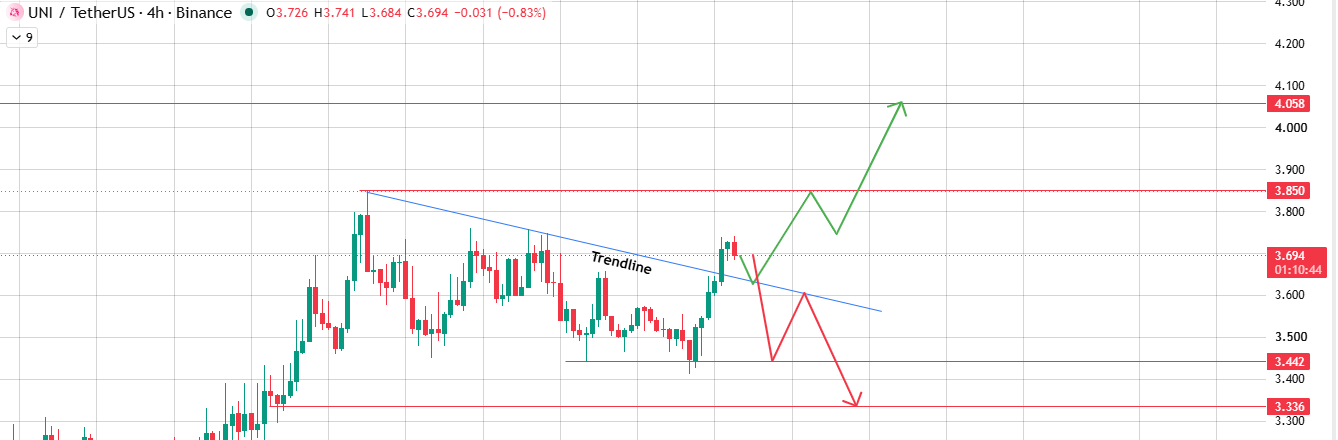
The break already happened; the retest is what decides the direction now.
Bounce off the old resistance level as new support, and that's a bullish breakout continuing toward $3.850, then $4.058 as the extended price target.
Fail to hold it, and that's a bearish breakdown toward the support zone at $3.442, with $3.336 as a secondary floor.
1D Chart: Sitting Right at the Triangle's Apex
On the daily, UNI has carved a symmetrical triangle for nearly two months and is now trading almost exactly at the apex.
Source: TradingView, UNI/USDT daily 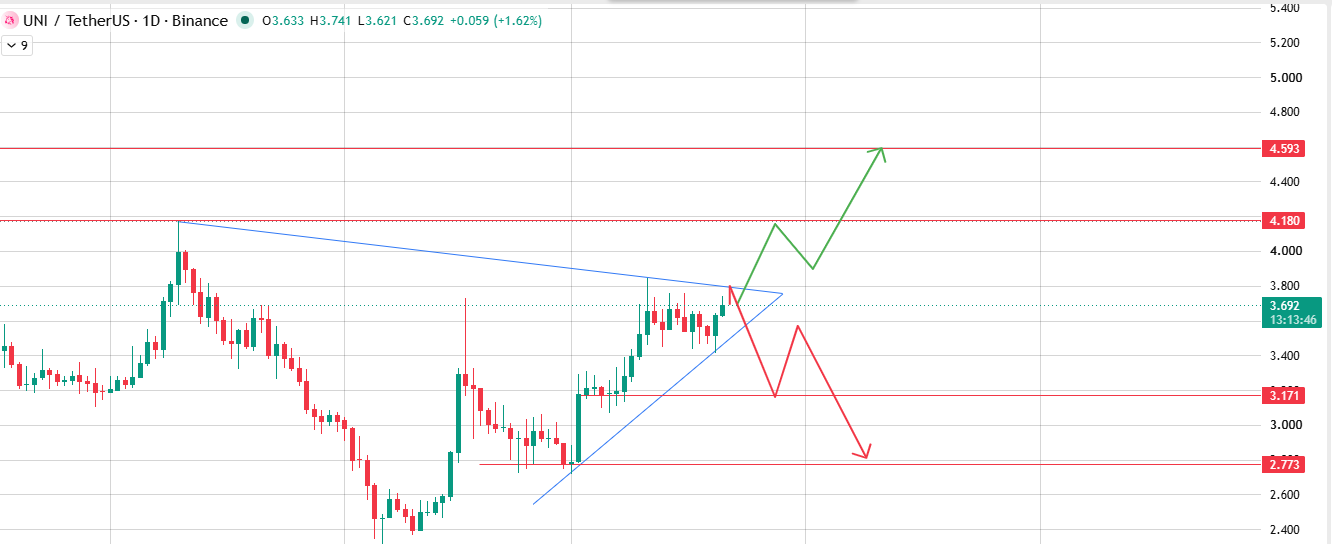
A confirmed close above the upper trendline points to $4.180, then $4.593. A close below the lower trendline opens $3.171, then $2.773.
Invalidation: a daily close back below $3.44 kills the bullish case outright. A daily close back above $3.85 kills the bearish one.
Key Takeaways
-
UNI trades at $3.69, up 6.9% in 24 hours, after breaking above a falling trendline on the 4-hour chart.
-
Hold the retest as support, and $3.850-$4.058 opens up; lose it, and $3.442-$3.336 is more likely.
-
The daily chart sits at the apex of a multi-week triangle, so the bigger move (toward $4.180-$4.593, or $3.171-$2.773) is likely days away.
-
A live governance vote to expand protocol fees and burn UNI closes in five days, adding a real fundamental trigger.
Three-Scenario Price Outlook (Next 5-10 Days)
| Scenario | Trigger | Price Target | Estimated Likelihood* |
|---|---|---|---|
| Bearish | Retest fails, daily closes below the triangle's lower boundary. | $3.442 → $3.336 → $3.171 / $2.773 | ~25% |
| Base Case | Chop between the trendline and triangle boundaries during the vote. | $3.55 – $3.85 | ~40% |
| Bullish | Retest holds, daily closes above the triangle's upper boundary. | $3.850 → $4.058 → $4.180 – $4.593 | ~35% |
Qualitative estimate based on short-heavy liquidation skew, the pending governance vote, and typical triangle-apex odds. Not a statistical model; a binary vote outcome can override it.
Risks and What Would Invalidate This View
-
Vote outcome: if the fee-switch/burn proposal fails or is delayed, the bullish tailwind weakens even if the chart resolves upward.
-
BTC-led risk-off: a sharp broad-market drawdown would likely override both chart setups.
-
Unlock overhang: ~267M UNI outside circulating supply is a standing sell-pressure risk independent of these levels.
-
Thin liquidity: 24h liquidations total just $155.89K, small enough that modest order flow can whipsaw either side.
BTC and ETH Correlation
UNI's move sits inside a backdrop shaped by BTC dominance trends and the usual ETH correlation DeFi tokens carry, given their dependence on Ethereum activity.
Steady majors give this retest room to resolve on its own merits; a sharp BTC or ETH swing would likely override it.
Final Outlook
Two tests, one window: hold the 4H trendline retest, and $3.850-$4.058 is the near-term path; lose it and $3.442-$3.336 is more likely.
The daily triangle apex points to the same fork on a bigger scale, $4.180-$4.593 or $3.171-$2.773. A live burn vote closing in five days sits directly on top of both.
Glossary
-
Trendline Retest: price returning to a broken trendline to test whether it now holds as support or resistance.
-
Symmetrical Triangle: a consolidation pattern of converging trendlines that typically resolves in a breakout near its apex.
-
Invalidation Level: the price point at which a given trade thesis should be abandoned.
-
Liquidation: forced closure of a leveraged position when losses exceed margin.
Methodology
Chart levels come directly from TradingView's UNI/USDT 4H and daily charts, captured at 01:10 IST and 13:13 IST on July 21, 2026, with no extrapolation beyond what's shown.
Liquidation and volume data are from Coinglass; holder data is from an on-chain snapshot taken about a minute before review.
The governance vote detail is sourced from a public X post and hasn't been independently verified against Uniswap's official forum; confirm the current status before acting on it.
Scenario likelihoods are qualitative estimates, not statistical projections. Open interest and funding rate data were unavailable at time of writing. Informational only, not financial advice.
Disclaimer: This article is for informational and educational purposes only and should not be considered financial, investment, or trading advice. Cryptocurrency markets are highly volatile, and prices can change rapidly. Always do your own research and consult a qualified financial advisor before making any investment decisions. Past performance does not guarantee future results.
0
0


 Manage all your crypto, NFT and DeFi from one place
Securely connect the portfolio you’re using to start.

0
0

0
0

0
0

0
0