Chainlink (LINK) Price Poised for Uptrend After 10% Fall
6d ago•

bullish:
1
bearish:
0
Share

Chainlink (LINK) jumped to $16.21 on June 12. Hours later, the price retraced, suggesting the initial hike was a false breakout.
However, interest in the decentralized Oracle network’s native token heightened as trading volume soared above $450 million over the past 24 hours.
Volume Rises, Network Underrated
As of this writing, the LINK price trades at $15.55, a 10.65% decrease in the last seven days. Chainlink’s surge on Wednesday was driven by the Consumer Price Index (CPI) outcome, which saw inflation drop below the predicted forecasts.
As a result, the broader crypto market—LINK inclusive—posted notable gains. However, the upswing was short-lived, as Bitcoin (BTC), alongside other altcoins, erased some of those gains.
Despite the decline, LINK seems close to a position that may drive another uptrend. The Network Value to Transaction (NVT) Ratio shows proof of this. Another evidence is reflected in the Market Value to Realized Value (MVRV) Ratio.
- Network Value to Transaction (NVT) Ratio: This metric results from dividing the market cap by the volume transacted on-chain. With the outcome, one can tell if a network is undervalued or overvalued.
- Market Value to Realized Value (MVRV) Ratio: This is the ratio between a cryptocurrency’s market value and its realized value. It uses the level of profitability to tell whether the price has hit a local top or is close to the bottom. As such, traders can use it to spot potential accumulation and distribution levels.
Read more: How to Buy Chainlink (LINK) With a Credit Card: A Step-by-Step Guide
According to data from Glassnode, Chainlink’s NVT Ratio fell to 93.04. Typically, a high NVT Ratio implies that the market cap is outpacing the growth of the transaction volume. Oftentimes, this means that the network is overvalued and coincides with the premium price of a token.
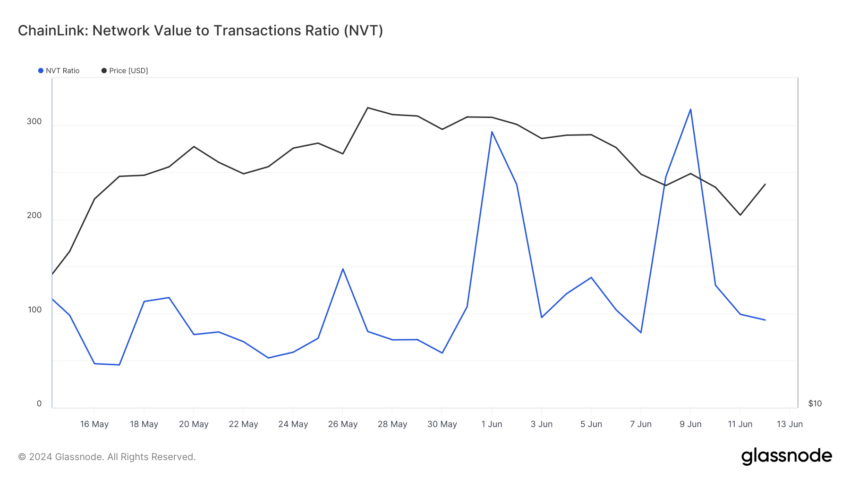 Chainlink Network Value to Transactions Ratio. Source: Glassnode
However, since the ratio was low for LINK, transaction volume has outperformed the project’s market cap. Therefore, the token is undervalued as the network efficiently handles many transactions.
Chainlink Offers a Chance to Buy
Further, on-chain data provided by Santiment reveals that the 30-day MVRV ratio was -9.02%. This negative reading means that if LINK holders sell at the current price, the average return will result in a loss around the aforementioned region.
However, historical data proves that the decline may be an opportunity zone for market participants to scoop LINK at lower prices.
As the chart below shows, LINK’s price bounces once the MVRV Ratio closes between -6% and -21%. For example, the token’s price increased from $12.96 to $18.77 in less than two weeks. This happened between May 15 and 28. At the start of the run, Chainlink’s MVRV ratio was -6.45%.
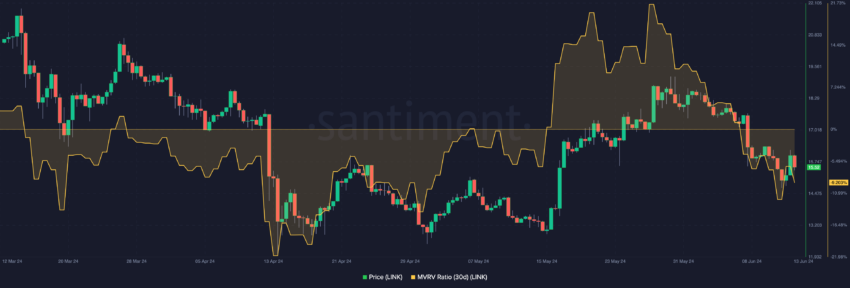 Chainlink 30-day MVRV Ratio. Source: Santiment
Another scenario occurred in April when the metric was -21.37%. During that period, LINK went from $13.08 to $15.62.
Read more: Chainlink (LINK) Price Prediction 2024/2025/2030
LINK Price Prediction: Revival Could Be Dicey
Considering the historical analysis and LINK’s current state, mentioning that a price increase may be close is not out of place. If validated, the price of LINK will slowly move up the chart. In addition, this may lead the token to $17.70 within a week or two.
In a highly bullish market condition, the price of LINK may rally above $18.57. However, indications from the liquidation heatmap may invalidate this prediction.
- Liquidation heatmap: This indicator predicts where large-scale liquidations may occur. Traders can use the heatmap to identify high areas of liquidity (usually colored in yellow). Furthermore, the concentration of potential high liquidity areas can attract prices toward the region.
According to Coinglass, a magnetic liquidity zone exists at $15.04, suggesting that LINK’s price may fall to that region if the uptrend gets rejected.
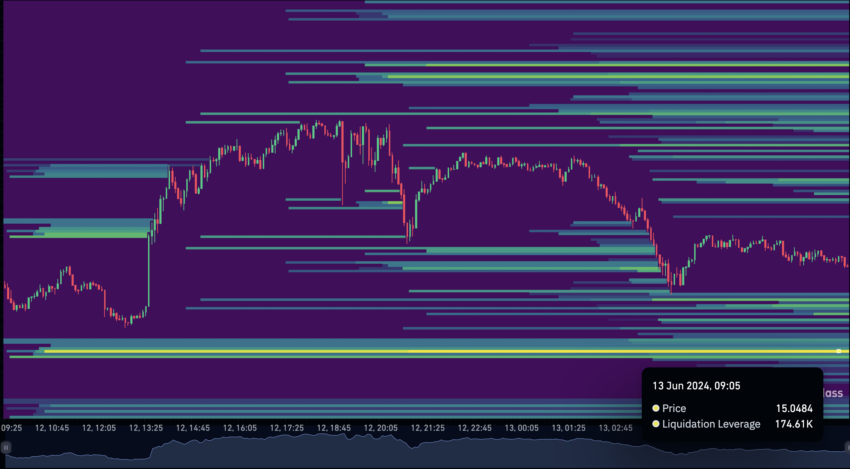 Chainlink Liquidation Heatmap. Source: Coinglass
At this point, bulls stand to lose $174,610. To avoid such losses, traders may need to set considerable stop-loss targets above the potential liquidation price.
6d ago•
bullish:
1
bearish:
0
Share


 Manage all your crypto, NFT and DeFi from one place
Securely connect the portfolio you’re using to start.

bullish:
0
bearish:
0

bullish:
0
bearish:
0

