Band Protocol Bullish? BAND Might Be a Good Buy, Here’s Why

1
0
PATNA (CoinChapter.com) — Band Protocol, a cross-chain data oracle project, has lined up some bullish cues for its native namesake token. BAND price has been in an uptrend throughout February, largely due to some partnerships, wider market trends, and a bullish technical pattern.
The project, a competitor of Chainklink, partnered with Layer-2 (L2) blockchain platform Blast. Per the announcement, the partnership would help enhance Blast’s infrastructure. Moreover, Band Protocol also shared another update on its partnerships.
Early in February this year, the blockchain oracle announced the integration with XION to provide “high-speed data queries, cross-chain compatibility, and customizable data feeds” to developers.
Apart from these partnerships, another bullish cue for the Band Protocol token comes from the recent spot Bitcoin ETF approvals and hopes for a similar performance from Ethereum ETFs in the coming months.
BAND Forms Bullish Technical Pattern
The movement of the Band Protocol token price has formed a familiar bullish technical pattern called the ‘Falling Wedge,‘ likely triggering some bullish indicators for BLOW.
A pair of converging trend lines form the falling wedge pattern. The pattern occurs when an asset’s price makes lower highs and lower lows steeper than the highs.
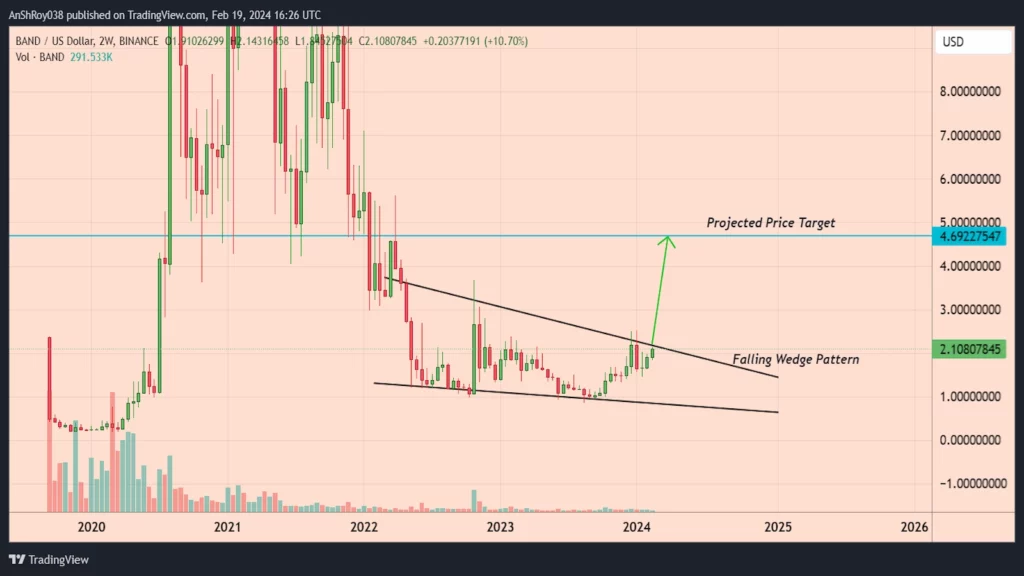
The familiar pattern typically signals that a reversal to the upside is likely. Customarily, the price target for the pattern is equal to the widest distance between the trend lines at the start of the pattern added to the breakout point.
A breakout with substantial volume can signify strong market conviction, thereby increasing the likelihood of continuing the trend.
Per the rules of technical analysis, the BAND price could spike nearly 123% to reach a theoretical price target near $4.7 if the pattern pans out.
BAND Price Continues Rallying
Meanwhile, bulls are trying to push the token’s price past the supply wall near $2.224, a price level BAND last closed above in Feb. 2023. However, the supply wall near $2.22 has continued to rebuff all recent uptrends of the token.
The long upper wicks on recent daily candles continue to highlight the bearish pressure against FLOW.
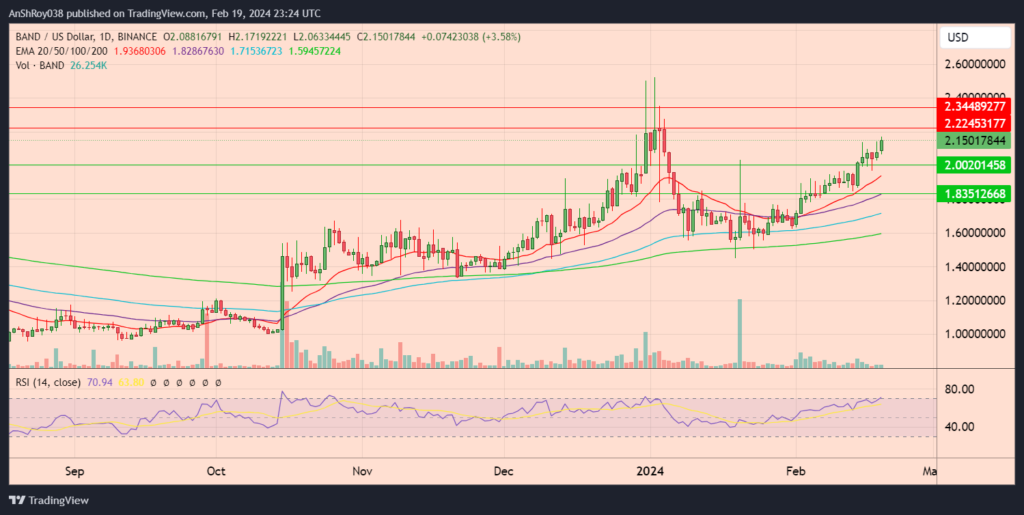
Yet, breaking past the immediate resistance could help BAND price rise to the resistance near $2.35 before retreating.
Band Protocol’s recent rally pushed its relative strength index (RSI) — a momentum indicator that measures the magnitude of recent price changes — above 70 to reach 70.94, indicating overbought conditions. Traders often consider the occurrence a sell signal since overbought RSI levels usually precede a bearish reversal or a consolidation phase for an asset.
To summarize, BAND price risks dropping to the resistance near $2 once the bull run fizzles out. Moreover, breaking below the immediate resistance could force the token to test the support near $2.35 before recovering.
The post Band Protocol Bullish? BAND Might Be a Good Buy, Here’s Why appeared first on CoinChapter.
1
0

 Manage all your crypto, NFT and DeFi from one place
Securely connect the portfolio you’re using to start.