
Cardano Price Prediction: ADA Gets a Boost From Injective Integration

0
0

Cardano price prediction watchers are looking at a genuinely interesting decision point right now.
$ADA has spent weeks grinding higher along a rising structure that keeps refusing to give up ground, and the kind of setup where the next few candles could define the next leg entirely.
The levels discussed below come from the 4-hour ADA/USDT perpetual chart and are most relevant to short-term positioning.
If the price closes decisively outside the ranges mentioned, this Cardano price prediction outlook should be rechecked rather than assumed to still hold.
Cardano Trend and Momentum: Key Takeaways
ADA is trading around 0.1839, holding just above the 0.1810 support zone
An ascending trendline sits directly below 0.1810, adding a second layer of support
A hold here keeps 0.2117 and then 0.2322 in play on the upside
A confirmed close below 0.1532 shifts focus to 0.1381
A close below 0.1381 would invalidate the current bullish structure
Risk warning: crypto markets are volatile, and leveraged positions can liquidate fast in either direction. Treat every level below as a zone to watch, not a guaranteed outcome.
Cardano Price Right Now
Metric | Value |
Current Price (CMP) | $0.1839 |
24h Change | -2.08% (-0.003904) |
Market Cap | $6.71B |
Futures Volume (24h) | $324.32M |
Spot Volume (24h) | $46.03M |
Open Interest | $457.99M |
Circulating Supply | 36.55B ADA |
Total Supply | 44.99B ADA |
Max Supply | 45.00B ADA |
Open interest of $457.99M reflects the total value of outstanding ADA futures contracts that have not yet been closed.
A rising open interest alongside price strength typically signals fresh money entering the trend, while a rise during price weakness often points to aggressive short positioning.
Chart source: TradingView, ADA/USDT Perpetual Contract, Binance, 4-hour timeframe, captured August 13, 2026, around 10:00 AM IST (04:30 UTC).
Data source: CoinGlass, Cardano market page, August 13, 2026, around 10:00 AM IST (04:30 UTC).
Methodology and Data Sources
This Cardano price prediction is built from the live chart structure on the ADA/USDT 4-hour perpetual pair, current market data from CoinGlass, and fresh liquidation flow.
No indicator readings are assumed beyond what the chart itself displays, and no external analyst targets are used in this breakdown.
Injective Testnet Rail Adds A Fresh Layer To Cardano Sentiment
A recent development worth watching alongside the technical setup: Injective announced it has established the first live on-chain rail to Cardano through testnet.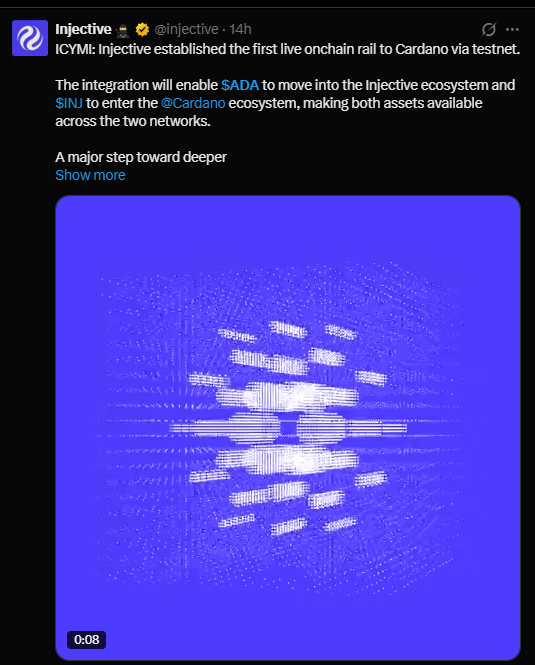
The integration is designed to let ADA move into the Injective ecosystem while INJ becomes usable within the Cardano ecosystem, effectively making both assets accessible across the two networks.
This kind of cross-chain plumbing does not move price immediately, but it does add to the broader narrative around Cardano's ecosystem expansion heading into the next few months.
Source: Injective (X post), 14 hours before publication, referenced August 13, 2026.
Cardano Liquidation Snapshot
The 12h and 24h windows show long liquidations dominating heavily over shorts, which lines up with the recent pullback from the 0.2000 zone toward current levels.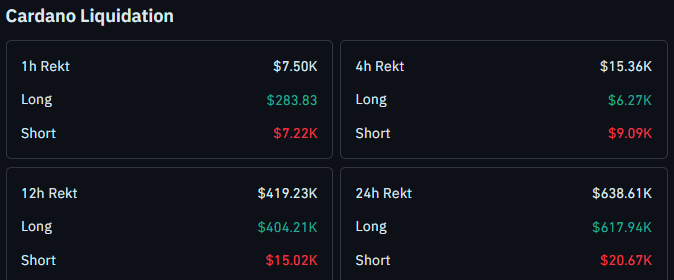
Short-term traders who leaned long into resistance got squeezed, while short positions have stayed relatively light in comparison.
Source: CoinGlass, Cardano liquidation data, August 13, 2026, around 10:00 AM IST (04:30 UTC).
Cardano Price Prediction: What the 4-Hour Chart Is Showing
Cardano is currently testing 0.1810 support with an ascending trendline positioned just beneath it, and this Cardano price outlook leans bullish above that zone with 0.2117 and 0.2322 as upside targets, while a confirmed close below 0.1532 would open the door toward 0.1381.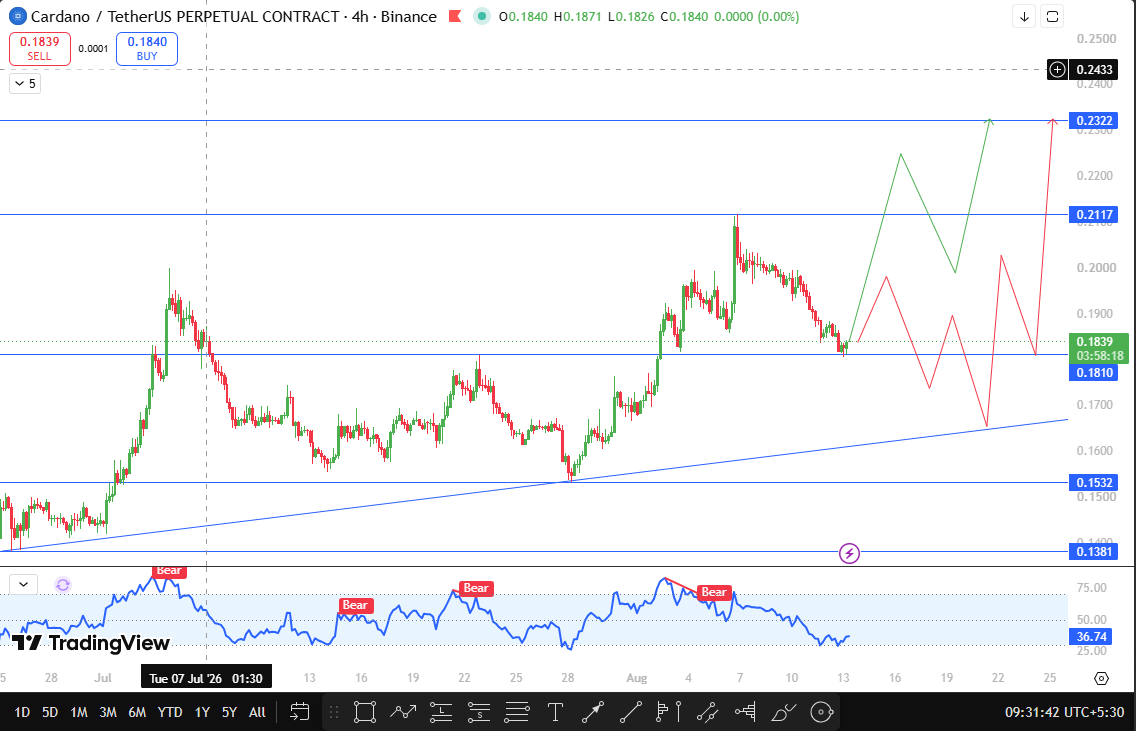
ADA has been climbing along a rising trendline for weeks now, and that structure is still intact heading into this test.
Price recently pushed up toward the 0.2000 region before pulling back, and it is now sitting right at the 0.1810 support shelf that has acted as a pivot zone on this chart before.
Below 0.1810, the ascending trendline itself becomes the second line of defense. Both levels sitting this close together is what makes this such a meaningful test for ADA trend analysis right now.
If buyers step in here, either from the horizontal support or from the trendline itself, the setup favors a move back toward the upper resistance band.
A reclaim and hold above this zone would put 0.2117 in focus first, with 0.2322 as the extended target if momentum carries through.
On the other side, a confirmed 4-hour close below 0.1532 would suggest the trendline has failed, shifting attention down to 0.1381 as the next meaningful support and technically keeping the broader bullish structure alive until that level too gives way.
ADA Technical Outlook Snapshot
Signal | Reading |
Built-in Momentum Indicator | Reading near 36.74, trending toward the lower Bear zone |
Trend Structure | Ascending trendline intact since the recent rally began |
Immediate Support | 0.1810, confirmed by trendline confluence |
Immediate Resistance | 0.2117 |
The chart's built-in oscillator is currently reading around 36.74 and has been drifting lower, having flagged a bear signal near the recent highs.
That cooling momentum matches the pullback price that has already been made from the 0.2000 region, and it is one more reason the 0.1810 zone matters so much right now.
ADA Support And Resistance Levels To Watch
Type | Level | % From CMP | Note |
Resistance 2 | 0.2322 | +26.2% | Upper target on a confirmed breakout |
Resistance 1 | 0.2117 | +15.05% | First target zone above CMP |
Support 1 | 0.1810 | -1.63% | Immediate support, trendline confluence |
Support 2 | 0.1532 | -16.7% | Next major support on a confirmed breakdown |
Support 3 | 0.1381 | -24.9% | Invalidation level for the bullish structure |
Risk-Reward Table
Case | Trigger | Target |
Bull Case | Hold above 0.1810 with the trendline intact | 0.2117, extending to 0.2322 |
Bear Case | Confirmed close below 0.1532 | 0.1381 |
Invalidation | Confirmed close below 0.1381 | Bullish structure is no longer valid. |
Downside Risks Worth Keeping In Mind
False breakouts are common around confluence zones like this one, where a support level and a trendline sit close together.
A brief wick below 0.1810 does not automatically confirm a breakdown, so waiting for a full candle close matters.
Leveraged positions also carry added liquidation risk in either direction given how thin some of these liquidity pockets can be, as the 12h and 24h liquidation data above already shows.
What Would Change This Cardano Price Prediction?
A confirmed 4-hour close below 0.1810 with the trendline also breaking would be the first real signal this setup is weakening.
A close below 0.1532 would confirm that shift, and a close below 0.1381 would fully invalidate the current bullish read on ADA.
How Bitcoin Sentiment Could Move Cardano
Cardano still tends to move with broader market risk appetite, and Bitcoin's direction often sets the tone for how altcoins like ADA behave around key technical levels.
A stable or strengthening Bitcoin backdrop would support ADA holding its current trendline, while renewed Bitcoin weakness could pressure ADA toward its lower support zones faster than the chart alone would suggest.
When This Cardano Price Prediction Gets Revisited
This setup will be revisited if ADA closes decisively above 0.2117 or below 0.1532 on the 4-hour chart, or if no clear resolution happens within the next 24 hours of trading.
Glossary
Open Interest: the total value of outstanding futures contracts that have not been settled or closed.
Liquidation: the forced closing of a leveraged position when losses hit a certain threshold.
Ascending Trendline: a rising support line connecting a series of higher lows, used to track an uptrend's structure.
Invalidation Level: the price point at which a technical thesis is no longer considered valid.
Bull, Base, and Bear Case
Bull Case: ADA holds above 0.1810 and the trendline, pushing toward 0.2117 and then 0.2322 as momentum returns.
Base Case: ADA chops between 0.1810 and 0.2000 for now, waiting for a clear catalyst before committing to either direction.
Bear Case: A confirmed close below 0.1532 sends ADA toward 0.1381, with a close below that level fully invalidating the current bullish structure.
Disclaimer
This content is for informational purposes only and should not be considered financial advice. Cryptocurrency markets are highly volatile, and prices can change rapidly. Always do your own research and consult a qualified financial advisor before making investment decisions. CoinGabbar and the analyst do not hold a position in ADA at the time of publication.
0
0


 Manage all your crypto, NFT and DeFi from one place
Securely connect the portfolio you’re using to start.

0
0

0
0

0
0

0
0