Chainlink price prediction 2024-2030: A strong buy sentiment for LINK?
3d ago•

bullish:
0
bearish:
0
Share
Key Takeaways
- Chainlink price prediction for 2024 could reach a maximum value of $26.06
- By 2027, LIINK could reach a maximum price of $77.65
- In 2030, Chainlink will range between $22.01 to $26.06.
Chainlink, one of the leading altcoins in the crypto market, has witnessed a notable resurgence in the wake of a significant drawdown. Currently trading at $13.83, the token has experienced a modest 1.66% price surge over the past 24 hours, signaling a positive shift in momentum.
The price of $LINK has increased by ~15% since this mysterious whale first accumulated $LINK.
And the whale has accumulated 5,587,368 $LINK ($112M) from #Binance via 55 addresses in the past 6 days.https://t.co/ds8Ghx6eyu pic.twitter.com/rqKjfwk95V
— Lookonchain (@lookonchain) February 11, 2024
This enigmatic figure has amassed a staggering 5,587,368 LINK tokens, valued at around $112 million, through 55 different addresses on Binance within just 6 days. Other substantial LINK accumulations have been observed, including one withdrawal of 495,057 LINK worth $7.5 million on multiple occasions at an average price of $15.12.
While these individual accumulations do not wholly represent broader trends within the Chainlink ecosystem, data from IntoTheBlock suggests a total whale accumulation of $176.98 million in the past 24 hours, marking a substantial increase of 13.44%.
Overview
| Cryptocurrency | Chainlink |
| Token | LINK |
| Price | $14.75 |
| Market Cap | $9,097,142,400 |
| Trading Volume | $435,703,382 |
| Circulating Supply | 587,099,970 |
| All-time High | $52.88 May 09, 2021 |
| All-time Low | $0.1263 Sep 23, 2017 |
| 24 High | $15.44 |
| 24 Low | $14.49 |
Chainlink Price Prediction: Technical Analysis
| Price Prediction | $22.59 (29.57%) |
| Volatility | 11.04% |
| 50-Day SMA | $15.12 |
| 14-Day RSI | 58.72 |
| Sentiment | Neutral |
| Fear & Greed Index | 73 (Greed) |
| Green Days | 15/30 (50%) |
| 200-Day SMA | $16.41 |
Today’s Chainlink price is $15.49, with a 24-hour trading volume of $435,703,382. Chainlink is up 1.13% in the last 24 hours. The current CoinMarketCap ranking is 15, with a live market cap of $9,097,142,400. It has a circulating supply of 587,099,970 LINK coins; the maximum supply is unavailable.
Chainlink price analysis: LINK corrects to $14.95 as bears strike
- Chainlink price analysis displays a bearish trend
- LINK hovers above the $14.00 mark despite bearish winds
- LINK/USD has lost over 2 percent in the past 24 hours
The Chainlink price analysis on June 15th, 2024, shows that LINK/USD has declined below $15.00 in the past 24 hours. The Bulls have been defending the $14.95 critical level, but the Bears pushed hard and managed to break it down.
As of press time, LINK/USD is trading at $14.95 with a bearish trend. The pair has lost over 2 percent since yesterday’s close. LINK/USD has declined from an intraday high of $15.44 during today’s session and appears to be heading toward $15.00 in the next few hours.
Chainlink price analysis 1-day chart: LINK bulls retreat as bears take charge
According to the daily chart, LINK/USD trades in the red, heading towards $15.44. Bulls struggle to keep the pair above the $14.00 level as bears continue to pressure the market sentiment.

LINK/USD 1-day chart, By TradingView
The RSI indicator is above 40 levels but has changed direction and is heading downwards. This suggests that the bears are gaining more control of the trend, and further downward correction could be on the horizon.
The Moving Average Convergence Divergence (MACD) looks positive as the MACD line is above the signal line, and the histogram remains intact. The Bollinger Band indicator also shows that the pair is in a bearish trend as the upper and lower bands continue to move apart, with the price failing to break above the lower band.
Chainlink price analysis hourly chart: LINK needs to close above $15.00 to continue its upward journey
The hourly chart for LINK/USD shows that the price is heading downward and is currently trading at $14.95. The buyers are trying to maintain the $14.00 mark, but the bears are pushing hard to break it down.
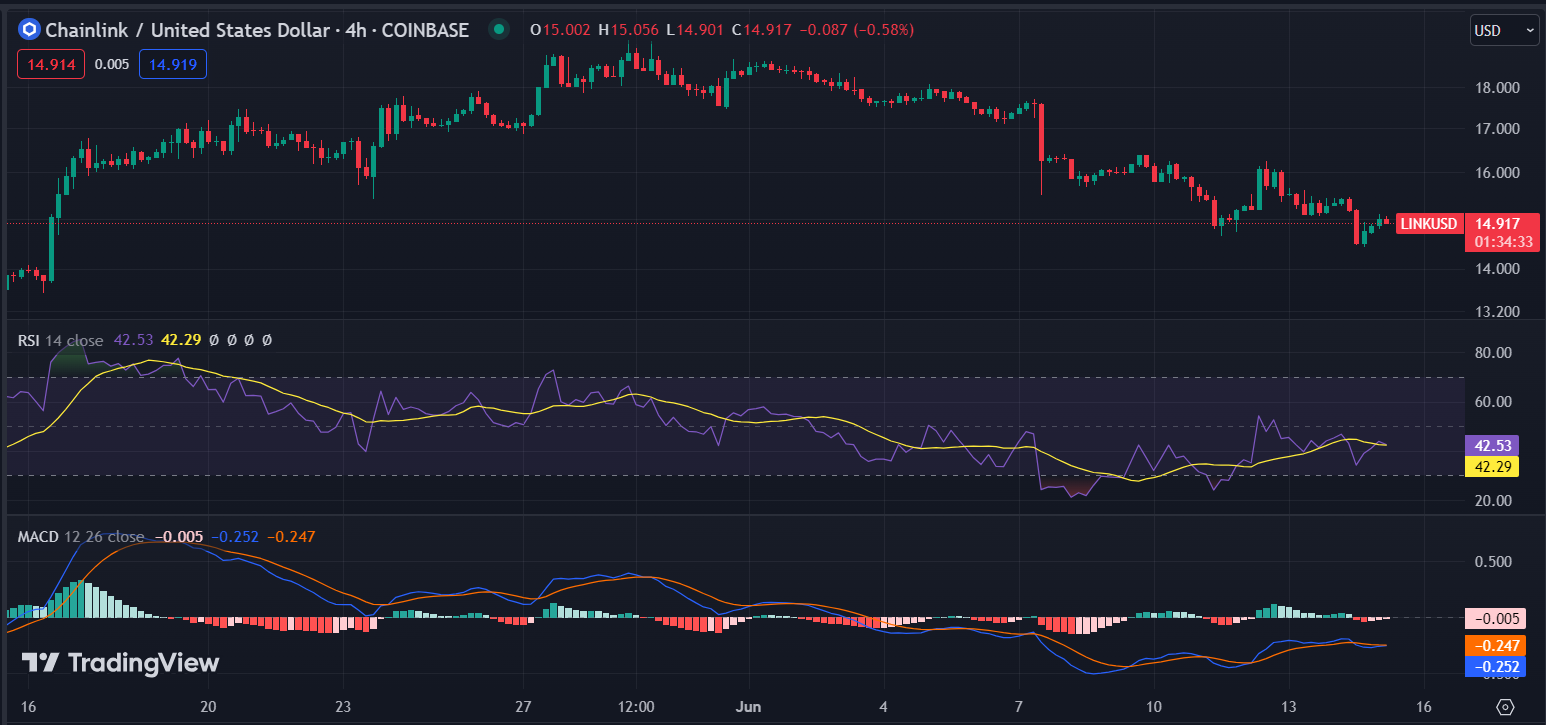
LINK/USD 4-hour chart, By Tradingview
The RSI indicator also shows a bearish bias as it has declined to 40 levels from its high of 42.53, indicating a weakening buying momentum. The MACD indicator looks bearish as the MACD line has crossed below the signal line, suggesting that bears control the short-term trend. Finally, the Bollinger band indicator has narrowed, indicating that LINK/USD could be range-bound soon.
Chainlink technical indicators: Levels and action
Daily Simple Moving Average (SMA)
| Period | Value | Action |
| SMA 3 | $17.93 | SELL |
| SMA 5 | $18.03 | SELL |
| SMA 10 | $17.74 | SELL |
| SMA 21 | $16.55 | BUY |
| SMA 50 | $15.12 | BUY |
| SMA 100 | $17.00 | BUY |
| SMA 200 | $16.41 | BUY |
Daily Exponential Moving Average (EMA)
| Period | Value | Action |
| EMA 3 | $17.96 | SELL |
| EMA 5 | $17.92 | SELL |
| EMA 10 | $17.61 | SELL |
| EMA 21 | $16.84 | BUY |
| EMA 50 | $16.22 | BUY |
| EMA 100 | $16.25 | BUY |
| EMA 200 | $15.38 | BUY |
What to expect from Chainlink price analysis
Chainlink price analysis shows that LINK/USD is correcting lower and may test the $15.00 level soon. For a longer-term uptrend to be established, bulls must close above the $15.00 mark and continue their upward journey. The selling pressure on the pair is increasing, and the bears are likely to take control of the trend if LINK/USD fails to hold the $14.95 level.
Recent news
Chainlink and Rapid Addition collaborate to create a FIX-native adapter for institutional digital asset trading. Powered by Chainlink’s CCIP, this adapter will enable banks and financial institutions to interact more efficiently with tokenized assets.
It aims to tap into markets like renewable energy, carbon credits, and real-world assets. This collaboration aims to lower technical barriers and enhance interoperability, facilitating institutional adoption of blockchain and crypto.
Chainlink price prediction June 2024
In June 2024, cryptocurrency experts prepared forecasts for the price of Chainlink. It is estimated that LINK will be trading between $14.49 and $15.44 in 2033. Its average cost is expected to be around $14.75 during the year.
| Chainlink Price Prediction | Potential Low ($) | Average Price ($) | Potential High ($) |
| Chainlink Price Prediction June 2024 | 14.49 | 14.75 | 15.44 |
Chainlink Price Prediction 2024
After analyzing the prices of Chainlink in previous years, it is assumed that in 2024, the minimum price of LINK will be around $14.49. The maximum expected LINK price may be around $15.44. On average, the trading price might be $14.75 in 2024.
| Chainlink Price Prediction | Potential Low ($) | Average Price ($) | Potential High ($) |
| Chainlink Price Prediction 2024 | 14.49 | 14.75 | 15.44 |
Chainlink price prediction 2025-2030
| Year | Minimum | Average | Maximum |
| 2025 | $31.49 | $32.63 | $39.03 |
| 2026 | $45.78 | $47.41 | $55.40 |
| 2027 | $67.18 | $69.55 | $77.65 |
| 2028 | $96.59 | $100.07 | $115.71 |
| 2029 | $138.60 | $142.60 | $171.69 |
| 2030 | $207.59 | $213.29 | $246.61 |
Chainlink Price Prediction 2025
The Chainlink price is forecast to reach its lowest possible level of $31.49 in 2025. According to our findings, the LINK price could reach its maximum possible level of $39.03, with an average forecast price of $32.63.
Chainlink Price Prediction 2026
Based on the technical analysis, Chainlink’s prices are expected to have the following minimum and maximum prices in 2026: about $45.78 and $55.40, respectively. The average expected trading cost is $47.41.
Chainlink Price Prediction 2027
According to a deep technical analysis of past price data of LINK, In 2027, the price of Chainlink is forecasted to be at around a minimum value of $67.18. The Chainlink price value can reach a maximum of $77.65 with an average trading value of $69.55.
Chainlink Price Prediction 2028
Experts in cryptocurrency have analyzed Chainlink’s prices and fluctuations during previous years. It is assumed that in 2028 the minimum LINK price might drop to $96.59, while its maximum can reach $115.71. On average, the trading cost will be around $100.07.
Chainlink Price Prediction 2029
The Chainlink price is forecast to reach its lowest possible level of $138.60 in 2029. According to our findings, the LINK price could reach its maximum possible level of $171.69, with an average forecast price of $142.60.
Chainlink Price Prediction 2030
The price of Chainlink is predicted to reach a minimum value of $207.59 in 2030. It could reach a maximum value of $246.61, with an average trading price of $213.29 throughout 2030.

Chainlink market price prediction: Analysts’ OP price forecast
| Firm | 2024 | 2025 |
| Gov.Capital | $27.41 | $53.94 |
| DigitalCoinPrice | $38.64 | $45.46 |
| Coindex | $23.00 | $ 75.86 |
Cryptopolitan’s Chainlink price prediction
According to our Chainlink price forecast, the coin’s market price might reach a maximum value of $26.06 by the end of 2024. In 2026, the value of LINK could surge to $55.40.
Chainlink’s historic price sentiment
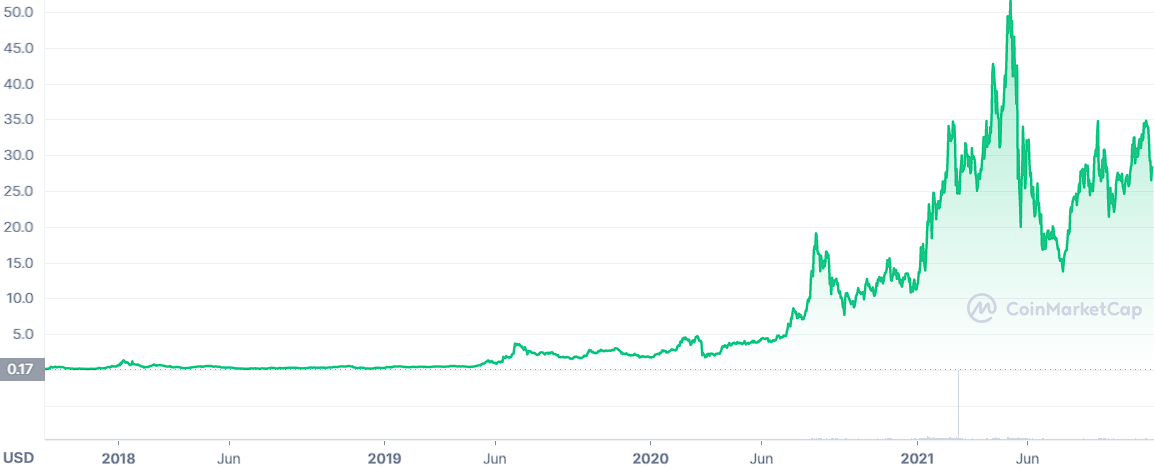
- 2018 began with a strong bullish rally, and most digital assets were at their summit. Chainlink token was not an exception. However, after that, a sharp freefall in the altcoins market resulted in billions of dollars being wiped out.
- 2019 was a very significant year for Chainlink. Its token LINK was performing very impressively in the market. The performance is heavily associated with the pioneering DApps on the Chainlink network and listing by a few crypto exchanges, such as Bitbox, the previous year.
- This drove the LINK price from $0.3 at the beginning of the year to a record $1.13 by May 2019. The oracle coin broke its ATH twice that year, and on June 24, 2019, LINK’s price reached a record $4.540. The release of the Chainlink network on the Ethereum main network heavily drove the bullish rally.
- In 2020, the Chainlink project emerged as the top performer of all cryptocurrencies, beating significant cryptocurrencies like Bitcoin and Ethereum for the second year. Bitcoin price The massive rally was heavily connected to the 2020 DeFi craze.
- LINK began trading at around $1.70 and hiked toward $4.570 in February. It remained quiet until mid-July when the price rallied toward a new ATH at $8.40. The rally continued, and Chainlink’s digital asset price almost hit $20 but faced rejection and pulled back to under $12.
- In 2021, Chainlink’s price enjoyed a strong bull run, as wavelike bullish activity caused the price to rise from $12.00 to recent highs of $36.00.
- Chainlink’s price faced strong resistance at the $36 mark, which it could not break through and was rejected. The rejection caused the price to fall to $23.50 before it bounced back to the $30 support level.
- Afterward, the coin reached its all-time high of $52.88 in May and started falling. The fall in the price of Bitcoin affected Chainlink until it was $30.
- Chainlink’s price trend was upward between May and June. For the year, it registered its highest price at $18.44.
3d ago•
bullish:
0
bearish:
0
Share

 Manage all your crypto, NFT and DeFi from one place
Securely connect the portfolio you’re using to start.

bullish:
0
bearish:
0


bullish:
0
bearish:
0

bullish:
0
bearish:
0