Jasmy (JASMY) Price Could Skyrocket, According to This Chart Pattern
8d ago•

bullish:
0
bearish:
0
Share

- Elliott Wave analysis suggests Jasmy (JASMY) may see a bullish reversal.
- Key support levels are identified at $0.025 and $0.026.
- Potential resistance levels are at $0.038, $0.048, and $0.05.
A 4-hour timeframe chart of JASMY/USDT analyzed using Elliott Wave Theory indicates potential bullish and bearish scenarios for the Jasmy (JASMY) token paired with Tether (USDT).
The current price movement suggests the possible continuation of an upward trend if specific conditions are met.
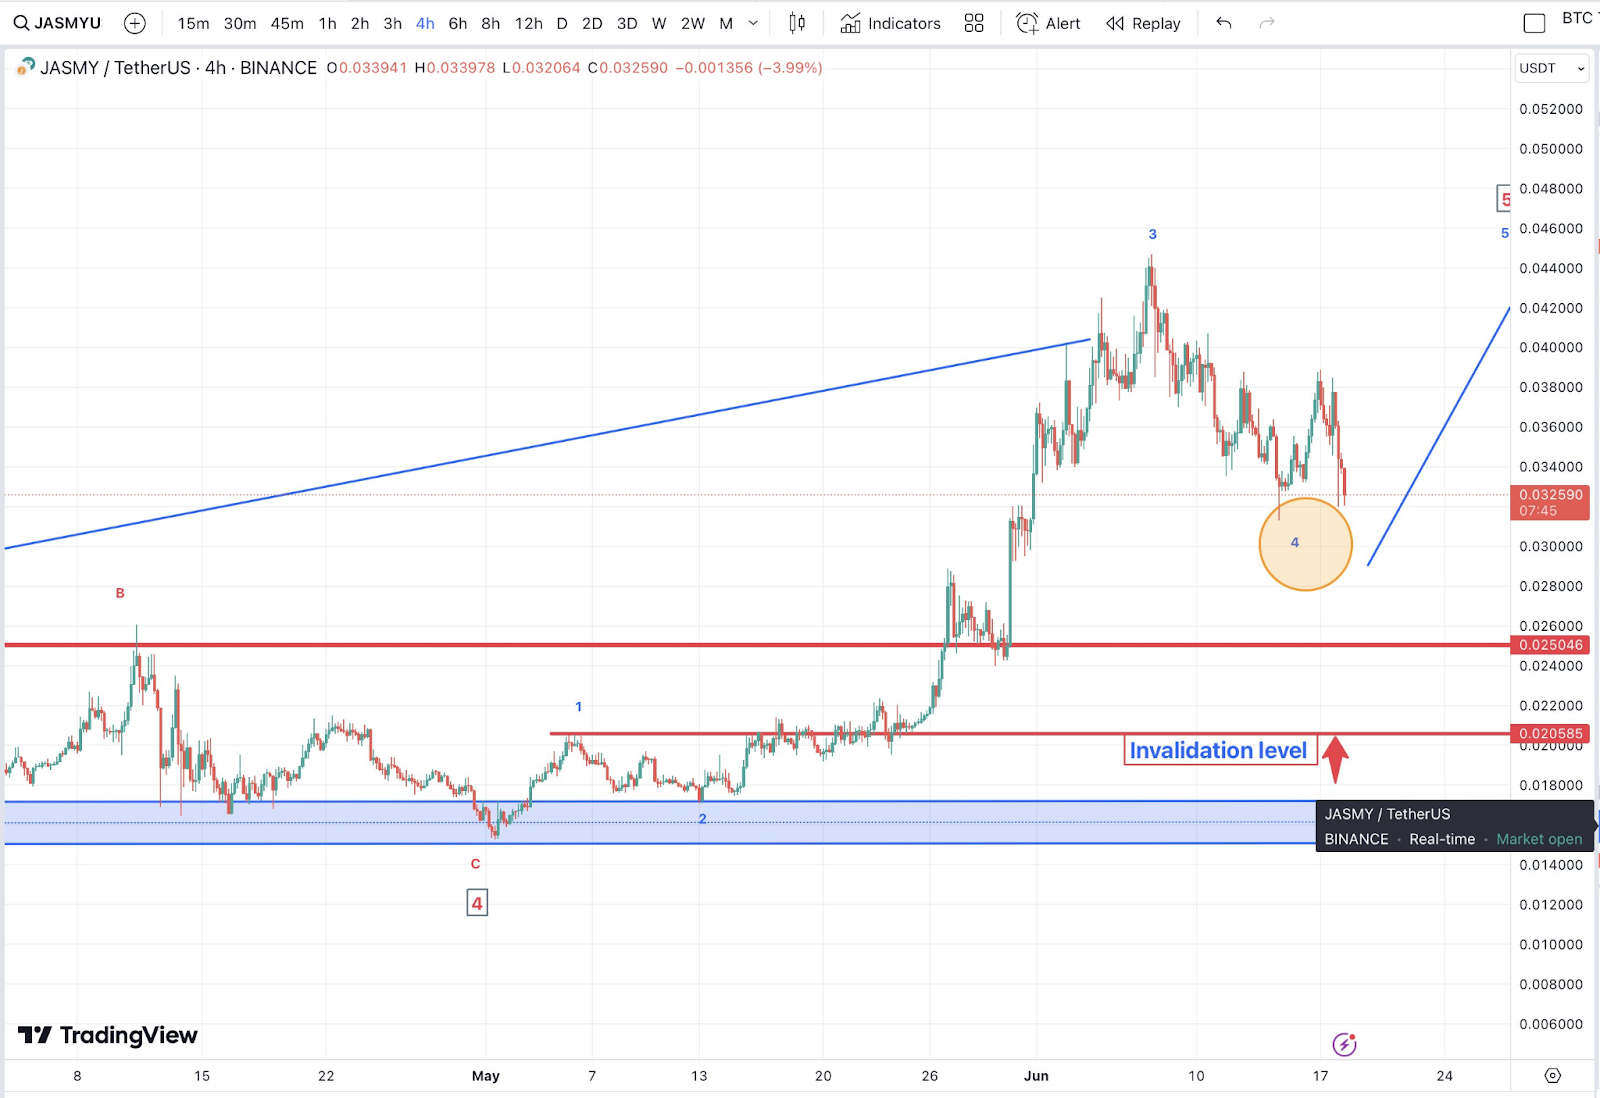
Source Matthew Dixon
The Elliott Wave Theory reveals a five-wave pattern in the JASMY/USDT chart. Waves 1, 2, and 3 have already completed, with Wave 3 peaking around $0.048. Wave 4 is currently in progress, indicating a correction phase. The price hovers around $0.032, marking a possible bottom for Wave 4. This price action suggests that the market might soon rebound and begin Wave 5.
The support level is around $0.025 to $0.026. This level is significant as it might prevent further declines. The resistance level is near $0.038. A breakout above this resistance might confirm the beginning of Wave 5.
In a bullish scenario, the price could reverse from the current level…
The post Jasmy (JASMY) Price Could Skyrocket, According to This Chart Pattern appeared first on Coin Edition.
8d ago•
bullish:
0
bearish:
0
Share

 Manage all your crypto, NFT and DeFi from one place
Securely connect the portfolio you’re using to start.

bullish:
0
bearish:
0

bullish:
0
bearish:
0

bullish:
0
bearish:
0

bullish:
0
bearish:
0