Polkadot (DOT) Price Eyes Sub-$6 Levels as Losses Loom
4d ago•

bullish:
0
bearish:
0
Share

Polkadot (DOT) holders may have to bear further declines unless something dramatic happens. This is the sign several indicators gave as the price continues to hover around $6.
Like other cryptos in the market, DOT price decreased in the last 24 hours. But will the altcoin escape another steep decline?
Polkadot Paints a Bleak Picture
According to data from Messari, Polkadot’s Sharpe ratio is -0.99. Sharpe ratio measures risk-adjusted returns for a cryptocurrency.
If the ratio is high, it means that the risk-to-rewards ratio is good, meaning that the crypto in question has a higher chance of producing a positive return. In most cases, a Sharpe ratio above 2 implies that a token could be a good investment.
However, DOT’s Sharpe ratio is -0.99, suggesting that the cryptocurrency may not be able to offer gains for holders in the short term.
Read More: How To Stake Polkadot (DOT)
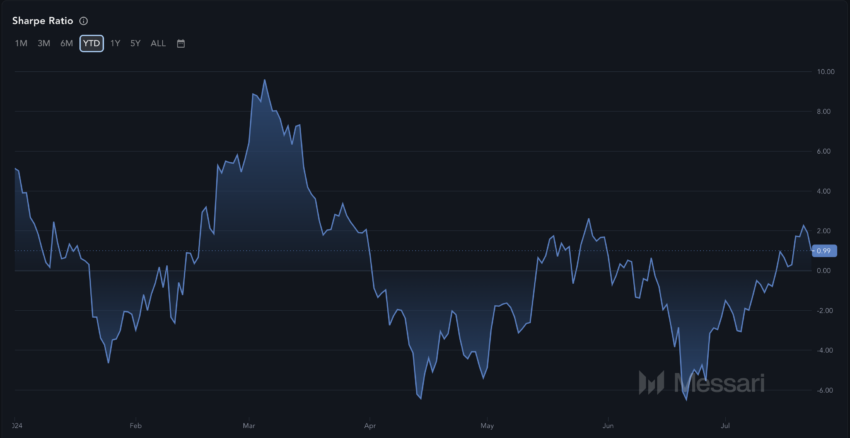 Polkadot Sharpe Ratio. Source: Messari
DOT currently trades at $6.03. If this trend continues, the cryptocurrency’s price could slip below the threshold sooner rather than later.
Another indicator fueling the bearish prediction is Polkadot social volume. Built on social data, social volume measures the rate at which market participants are searching for a cryptocurrency.
When this happens, demand for a token tends to increase, which later drives a price increase. However, at press time, the social volume is down compared to the readings it was a few days back.
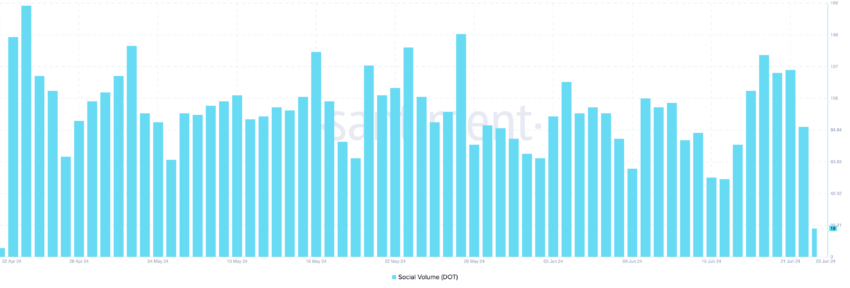 Polkadot Social Volume. Source: Santiment
Should this linger in the coming days, DOT’s price could drop, as mentioned earlier.
DOT Price Prediction: The Struggle Continues Unless…
Based on the daily chart, the support area around $5.45 was crucial to DOT’s rise above $6. However, the token encountered a 7.64% decrease after the price reached $6.49 on July 22. As a result, DOT’s price hit $5.96 before its recent recovery.
Further, indicators reveal that Polkadot is not yet out of danger. One reason is that the price continues to trade below the 20 EMA (blue). EMA is an acronym for Exponential Moving Average (EMA), which indicates whether a trend is bullish or bearish.
If the price is above the EMA, the trend is bullish. But in DOT’s case, it is below it, suggesting that a further decline could be close. Likewise, the Relative Strength Index (RSI) is below the 50.00 neutral point.
Read More: 5 Best Polkadot (DOT) Wallets To Consider In 2024
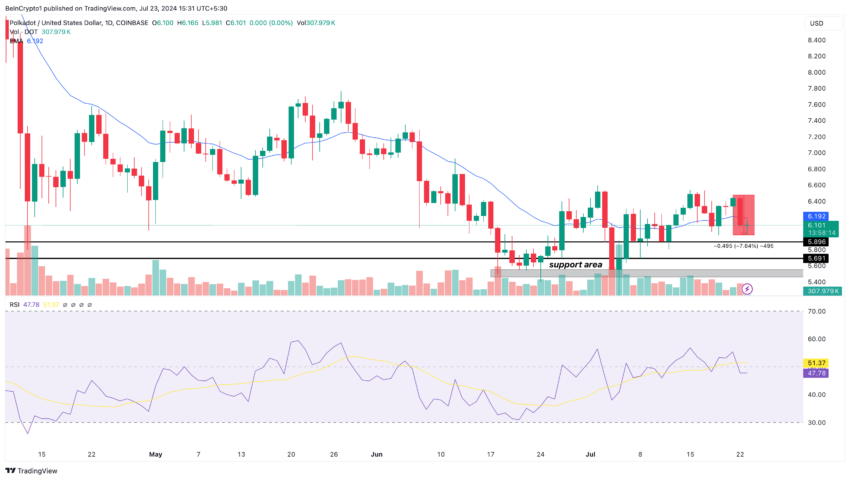 Polkadot Daily Analysis. Source: TradingView
As a measure of momentum, the RSI reading below the midpoint implies that the token could move in a bearish direction. Should bulls fail to change the situation, DOT’s price could drop to $5.89 and possibly $5.69 if selling pressure increases.
However, this prediction may become invalid if the broader altcoin market sees notable respite. If this happens, DOT could attempt to hit $6.52.
4d ago•
bullish:
0
bearish:
0
Share

 Manage all your crypto, NFT and DeFi from one place
Securely connect the portfolio you’re using to start.

bullish:
0
bearish:
0


bullish:
0
bearish:
0