Daily Market Review: BTC, DOGE, TAO, STX, SHIB
14d ago•

bullish:
0
bearish:
0
Share

Bulls show massive dominance today, as seen from the increasingly global market cap. The total cap stood at $2.33T as of press time, representing a 5% increase over the last 24 hours. The trading volume stood at $73.7B, representing a 4.2% increase over the same period.
Bitcoin Price Review
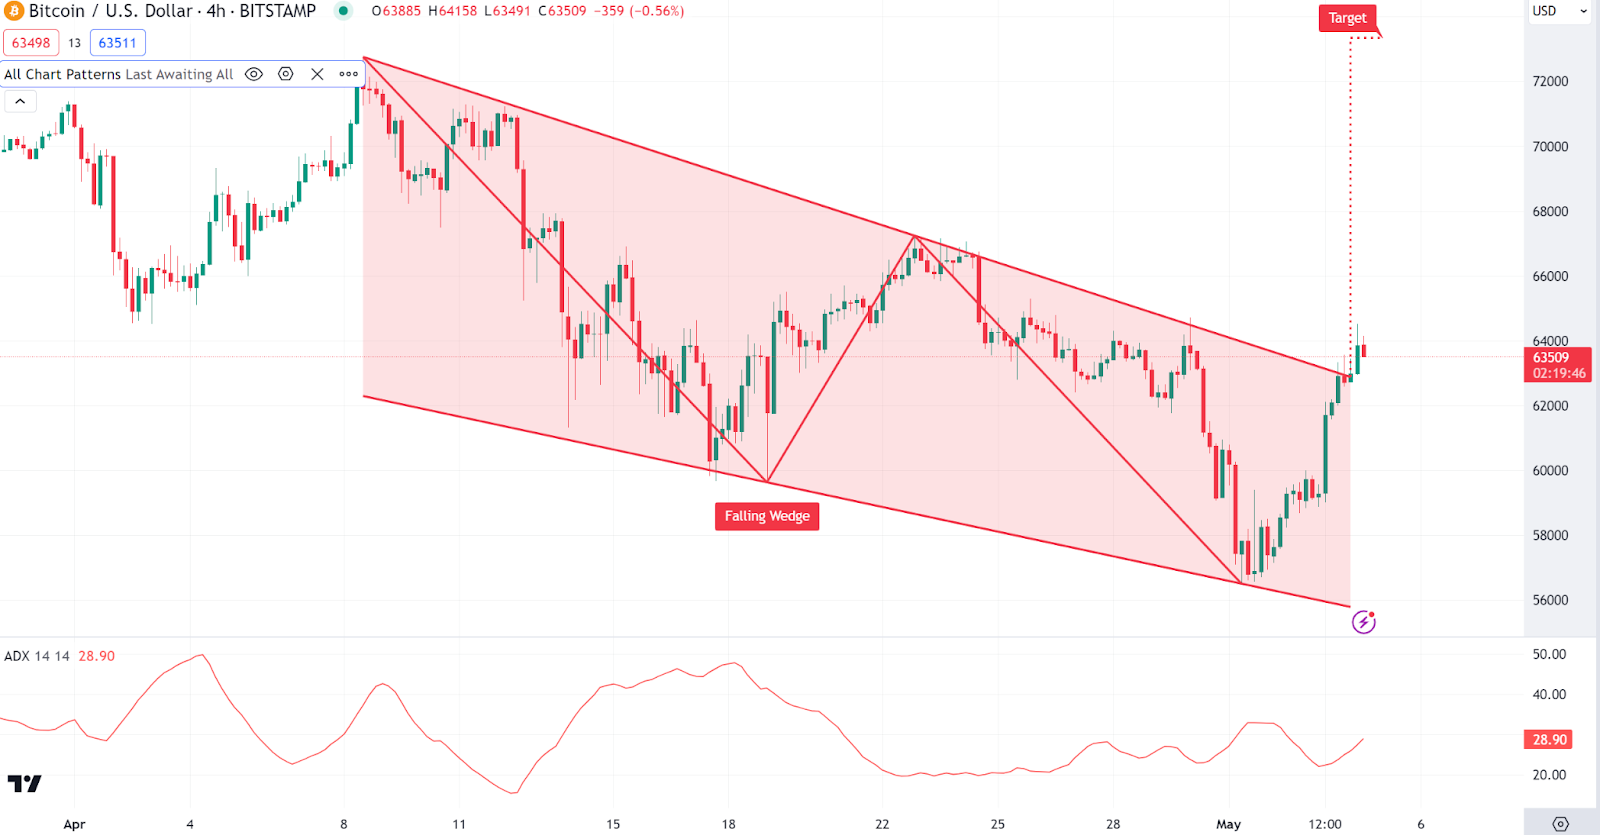
Bitcoin (BTC) is showing massive gains today, as evidenced by its price movements. Looking at an in-depth analysis, we see that the recent candlesticks show a breakout above the upper trendline of the falling wedge, suggesting potential bullish momentum ahead.
On the other hand, the ADX (Average Directional Index) is currently at 28.90, indicating a strong bull trend presence. As of press time, the Bitcoin price stood at $63,679, representing a 3.2% jump from its previous 24-hour price.
Dogecoin Price Review
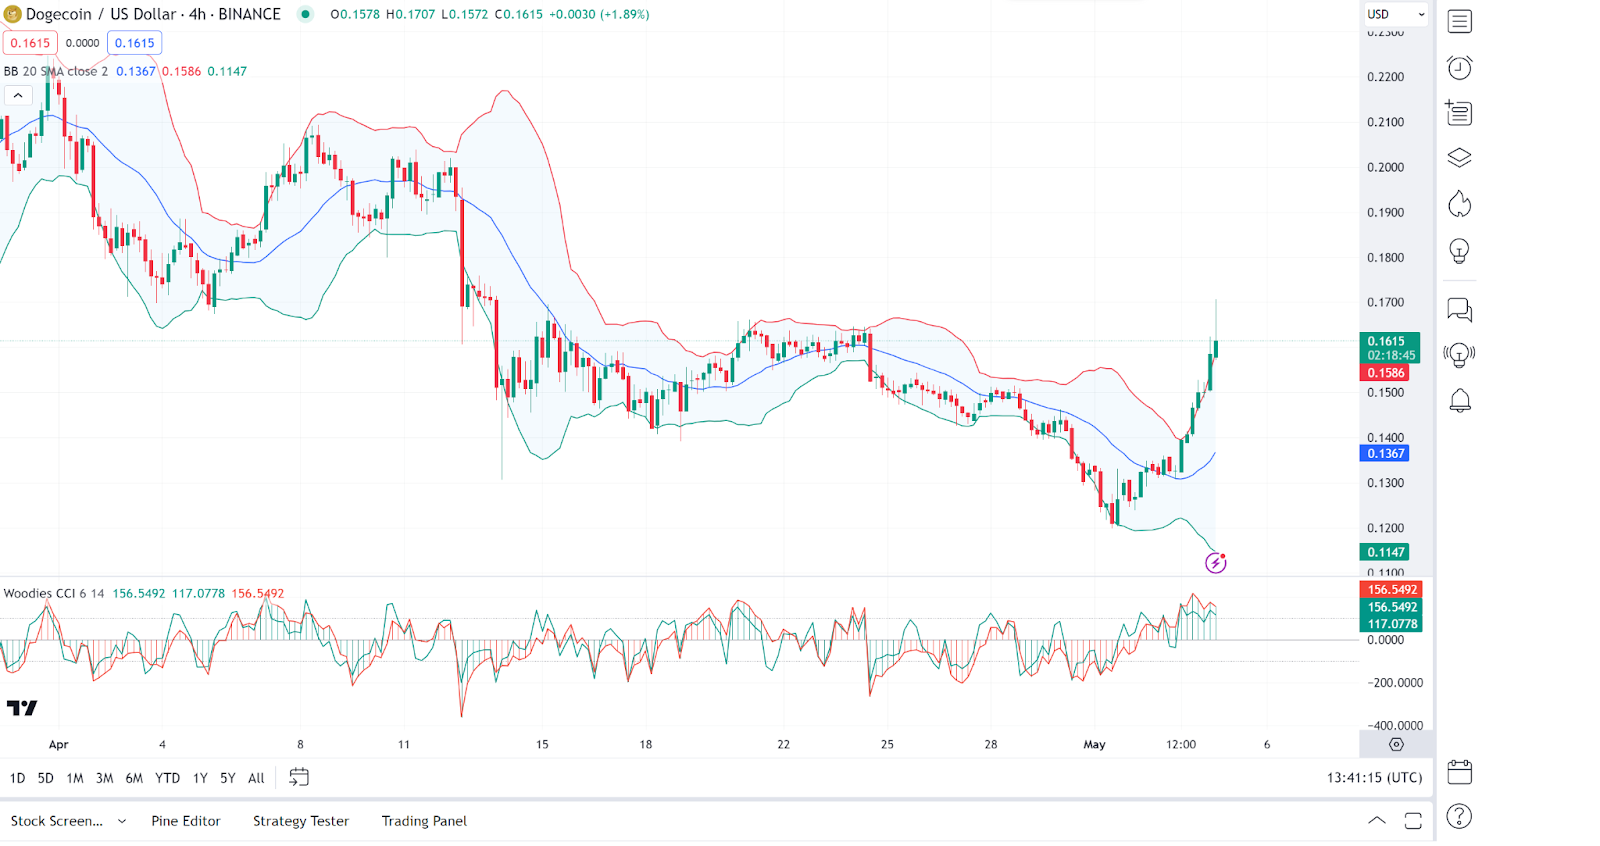
Dogecoin (DOGE) is also another gainer in today’s session, as seen from its price movements. An in-depth analysis shows that if sustained, the Dogecoin price breaking above the Bollinger Band could suggest a potential overbought condition or the start of a new bullish phase.
On the other hand, the CCI (Commodity Channel Index) is significantly high, pointing to a potentially overbought situation that traders might watch for a reversal or continuation signal. As of press time, the Dogecoin price stood at $0.1632, representing an 18% jump from its previous 24-hour price.
Stacks Price Review
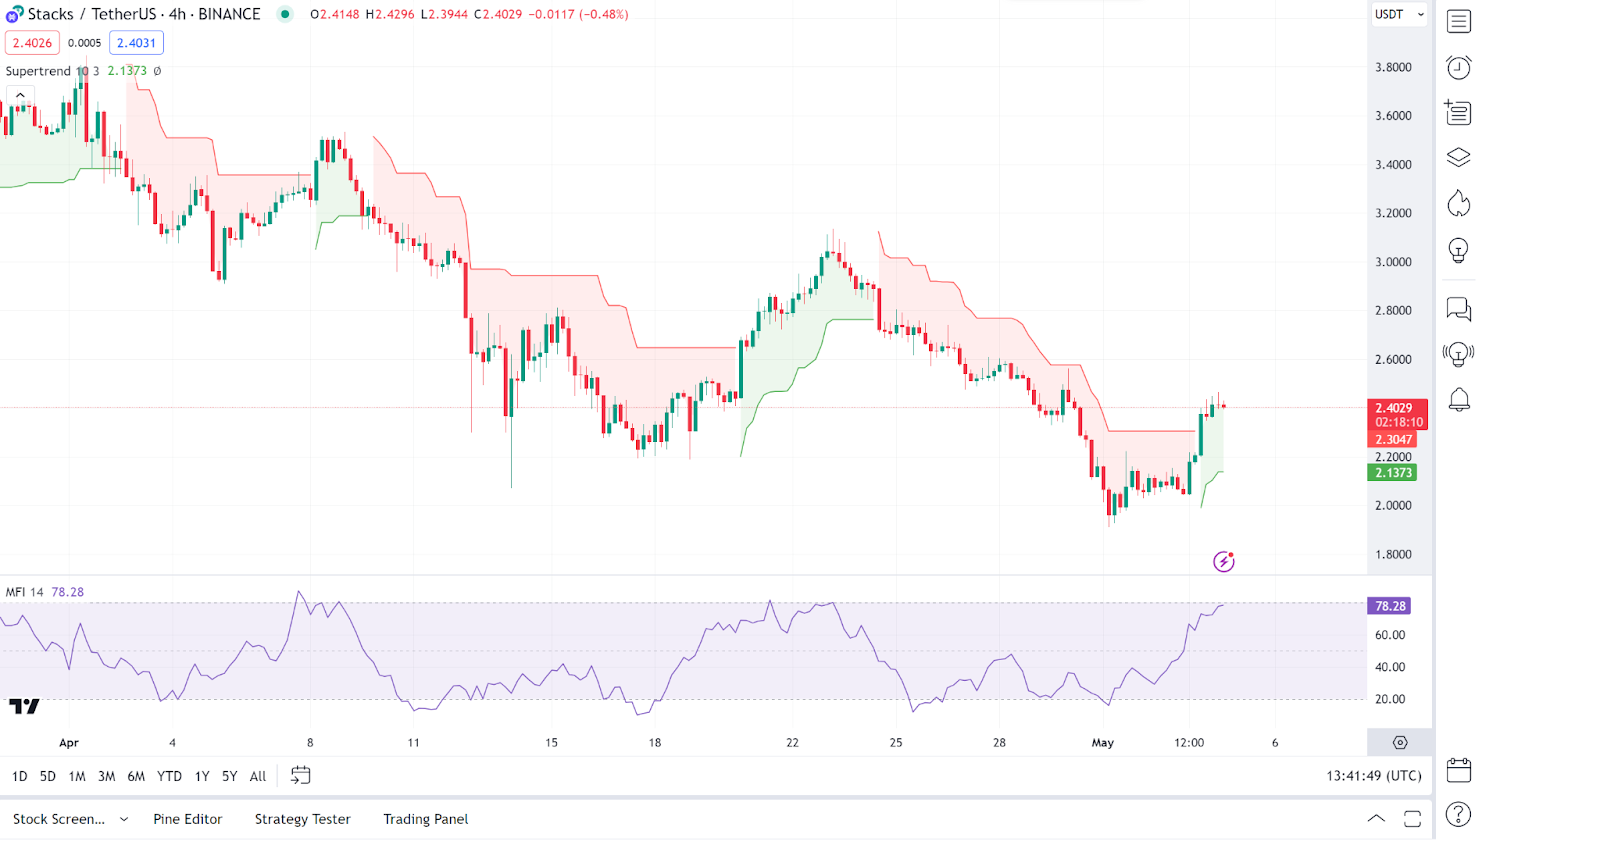
Stacks (STX) is among today’s top gainers as seen from its price increase in today’s session. Analyzing stacks price charts, we see that the price has recently crossed above the Supertrend line, turning it from red to green, which typically suggests a bullish reversal signal.
On the other hand, looking at indicators, we see the MFI (Money Flow Index) is at 78.28, indicating that the asset might be approaching overbought levels, which could lead to a temporary pullback or consolidation. As of press time, the Stacks price stood at $2.41, representing a 10% jump from its previous 24-hour price.
Bittensor Price Review
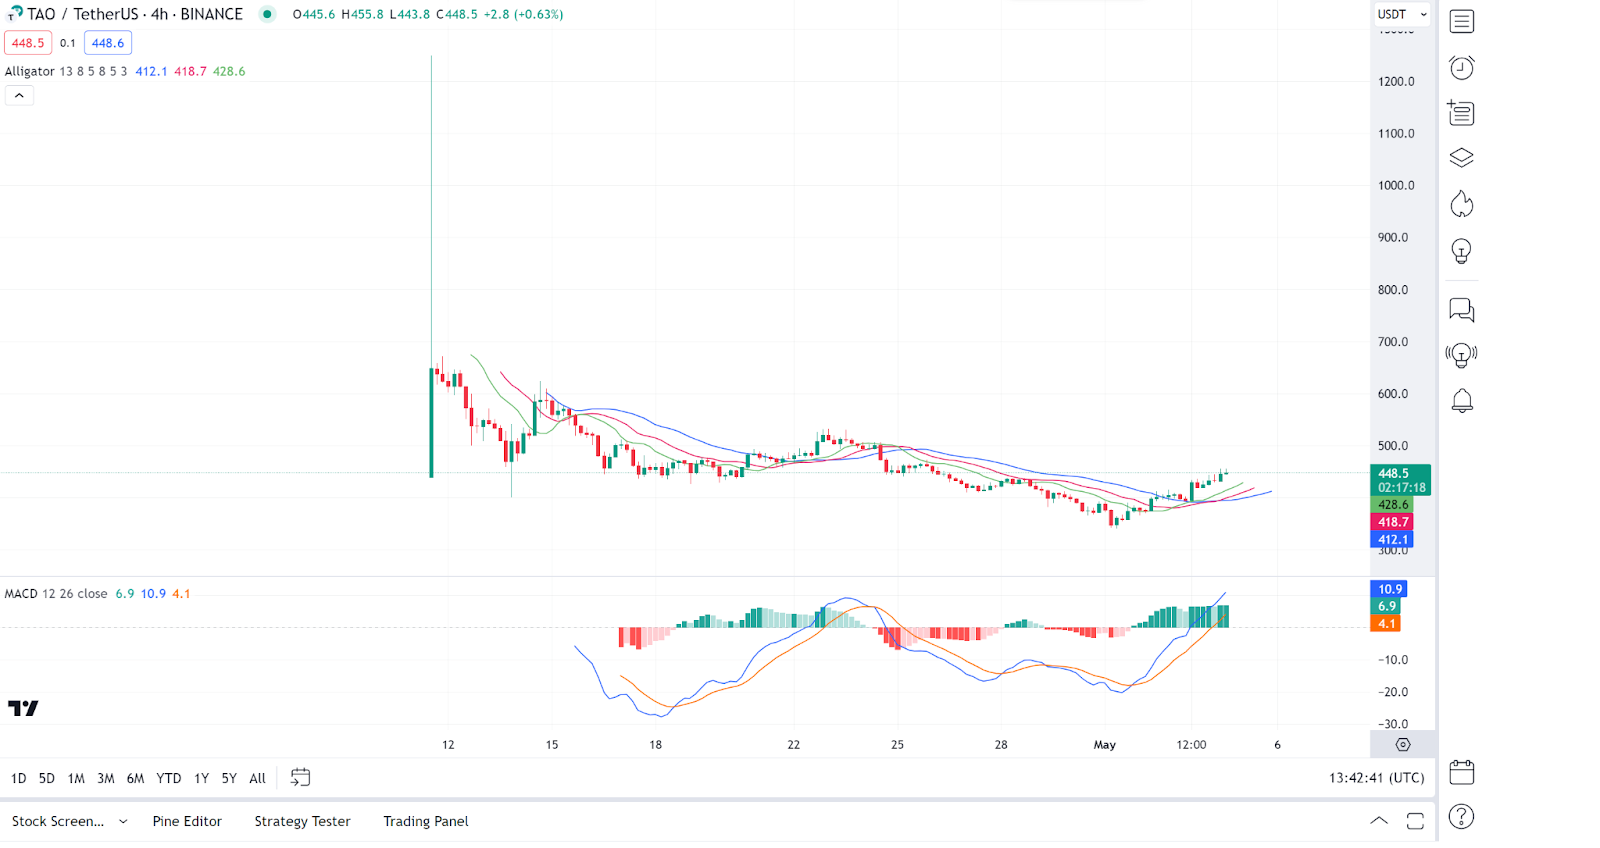
Bittensor (TAO) is another gainer in today’s session as evidenced by its price movements today. Looking at in-depth analysis, we see that the green line (jaw) of the Williams alligator is on top, followed by the red line (teeth) and the blue line (lips) below, suggesting that the market could be in a phase where the trend is pausing or potentially reversing to a downward trend, given the typical interpretation when the jaw leads the configuration.
On the other hand, the MACD (Moving Average Convergence Divergence) shows a bullish crossover (the MACD line crossing above the signal line), supportive of a potential upward move. As of press time, the Bittensor price stood at $448.1, representing a 7.1% jump from its previous 24-hour price.
Shiba Inu Price Review
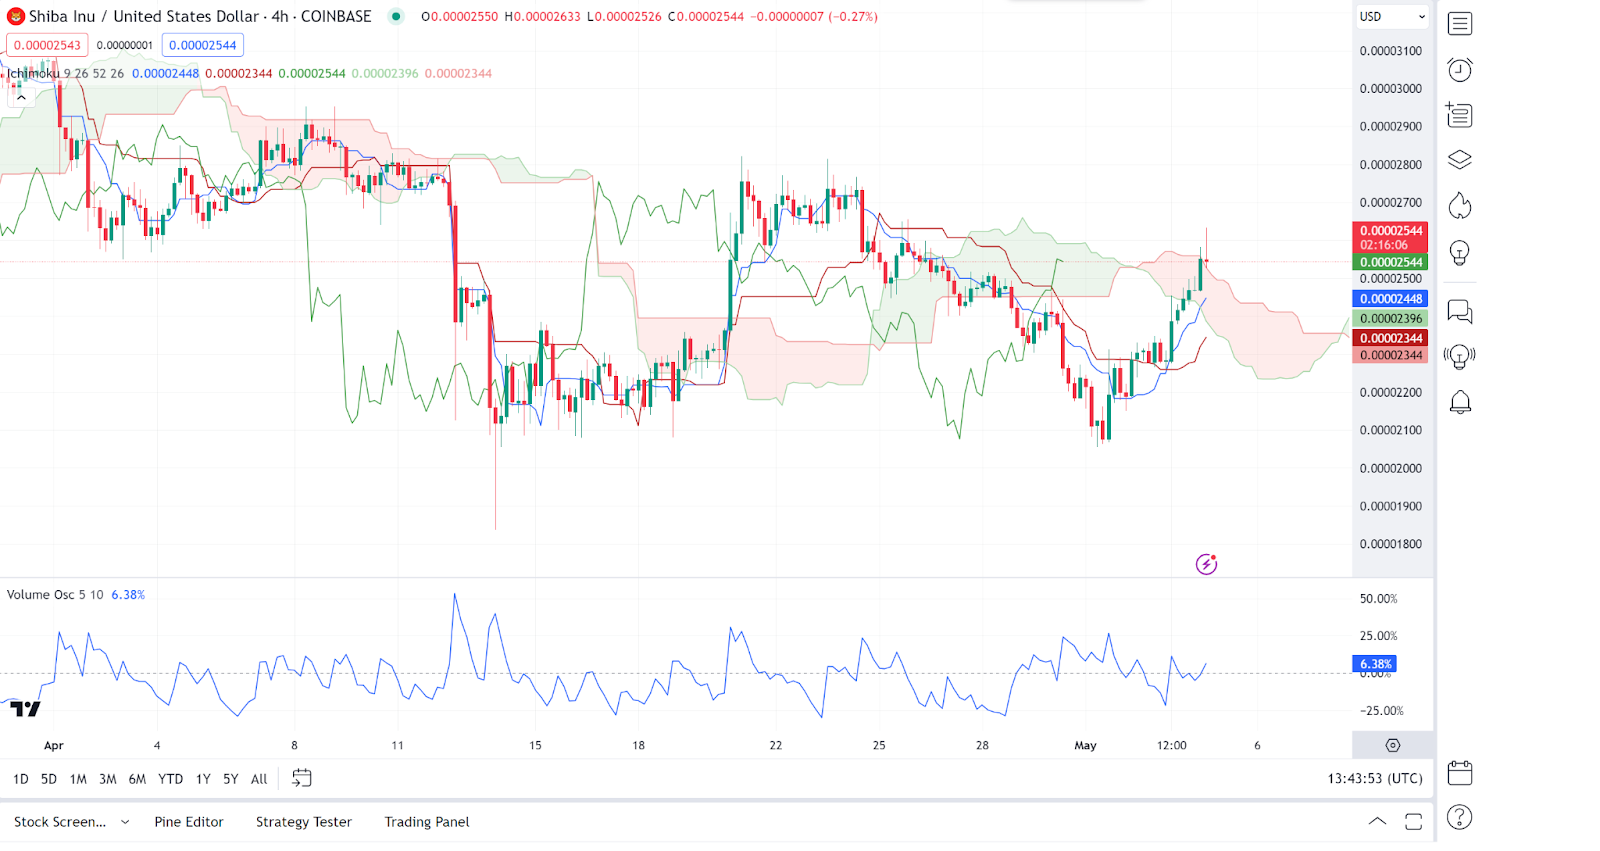
Shiba Inu (SHIB) is another gainer in today’s session, as evidenced by its piece movements. Analysing Shiba Inu price charts, we see that the Shiba Inu price is currently positioned between the cloud layers, indicating a lack of clear trends in the immediate term.
On the other hand, the Volume Oscillator does not show a significant volume increase, which should typically accompany strong price movements to confirm trend strength or reversal. As of press time, the Shiba Inu price stood at $0.00002553, representing a 5.1% jump from its previous 24-hour price.
14d ago•
bullish:
0
bearish:
0
Share
 Manage all your crypto, NFT and DeFi from one place
Securely connect the portfolio you’re using to start.

bullish:
0
bearish:
0

bullish:
0
bearish:
0

bullish:
0
bearish:
0

bullish:
0
bearish:
0