
Dash Price Prediction: $DASH Broke Descending Channel, What's Next?

0
0

Dash also just announced a wallet integration with Guarda, making it easier to hold and use $DASH for everyday transactions, according to its own project materials.
This Dash Price Prediction looks at whether $DASH can confirm a breakout from its recent descending channel over the next one to two weeks, a case that would be invalidated by a confirmed close below $29.53.
Here's what's driving the move and what the chart says next.
Dash Price Prediction Today: Market Overview
Metric | Value |
Price | $31.69 |
Market Cap | $405.23M (+5.82%) |
24h Volume | $55.01M (+42.42%) |
Vol/Mkt Cap (24h) | 13.28% |
FDV | $598.85M |
Total Supply | 12.78M DASH |
Max Supply | 18.9M $DASH |
Circulating Supply | 12.78M $DASH |
Source: Data from CoinMarketCap as of 1/08/2026. Figures may vary slightly across other tracking websites.
Dash crypto news: DASH Guarda Wallet Integration: What's New
$Dash's official account announced a partnership with Guarda Wallet, giving $DASH holders another easy way to store and use the coin. 
Source: Data From X
The post frames $Dashpay as being built for practical, everyday digital cash use.
This is a utility and accessibility update rather than a price-moving catalyst on its own, so it's worth noting as context rather than a driver behind today's move.
$Dash Prediction Chart: Technical Analysis
Pair: $DASH/USDC · Market: Spot (Crypto) · Exchange: Coinbase · Timeframe: 4H · Source: TradingView · Timestamp: August 1, 2026, 14:47 UTC+5:30
$DASH trades at $31.69, up slightly on the candle after a sharp bounce off support near $29.53.
Price had been sliding through a descending channel since late July, following a breakdown from a choppy zone near $34–35, and is now testing the upper boundary of that channel, which confirmed a clean break of the channel if price follows up and breaks the $32 level.
The EMA 20 ($30.76) EMA (exponential moving average) readings that weigh recent candles more heavily than a simple average and the EMA 50 ($31.38) have both just been reclaimed with today's bounce.
RSI (14), the Relative Strength Index, a momentum gauge reading above 70 as overbought and below 30 as oversold, sits at 62.55, elevated and showing real momentum without yet flagging overbought.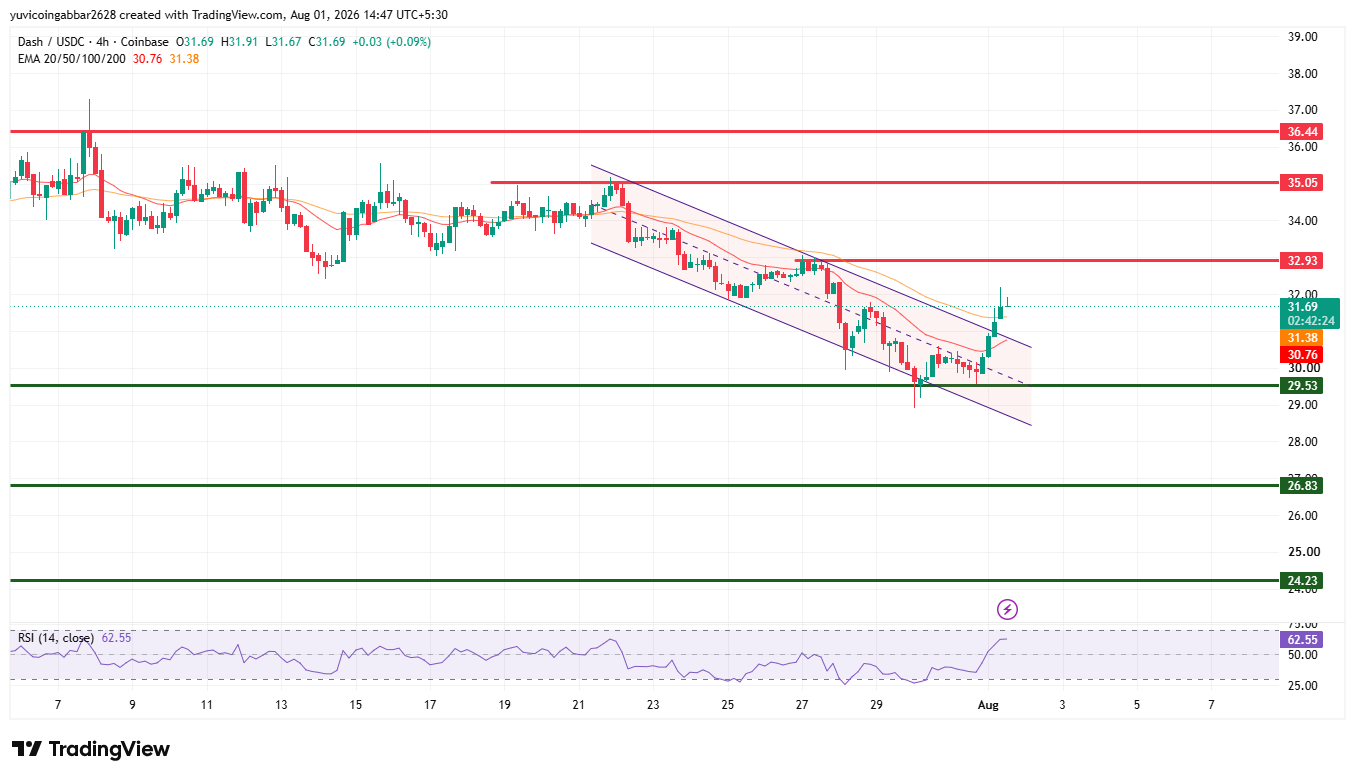
Level Type | Price |
Resistance 3 | $36.44 |
Resistance 2 | $35.05 |
Resistance 1 | $32.93 |
Immediate Price Reference | $31.69 |
Level (EMA 20/50) | $30.76 / $31.38 |
First Support | $29.53 |
Deeper Support | $26.83 |
Extended Downside Support | $24.23 |
Price is currently pressing against the descending channel's upper support near $32.93, which is what needs to break and hold for the channel breakout to be sustained.
Dash Forecast: Bull Case vs. Bear Case
Dash price target Bull case: With the EMA 20/50 cluster already reclaimed, a confirmed close above the channel trendline near $32.93 would mark a genuine breakout from the descending channel, opening $35.05 next and $36.44 as a further target.
RSI at 62.55 still has room before flagging overbought, supporting continued near-term strength.
Dash price target Bear case: A rejection at the channel trendline, followed by a break back below the EMA cluster and then the $29.53 support, would signal the descending channel is still intact and the bounce has failed.
That would open $26.83 first and $24.23 if the move extends further.
$Dash price forecast: Can DASH Reach $36.44?
A move to $36.44 would be a stretch beyond the near-term bull case.
It would require $DASH to first confirm the channel breakout above $32.93, then clear $35.05 and hold above it a multi-stage move where each level needs to break in sequence rather than all at once.
What Could Invalidate the Bullish Setup?
A rejection at the channel trendline near $32.93, followed by a confirmed close back below the EMA 20/50 cluster and then $29.53, would invalidate the breakout attempt and signal the descending channel remains in control.
That would open $26.83 and $24.23 if the breakdown extends.
Dash Price Prediction Methodology
This forecast draws on multiple inputs rather than a single chart pattern: the descending channel structure, EMA positioning relative to price, RSI momentum, the day's volume surge, and broader context around the Guarda Wallet integration. No single input is treated as decisive on its own.
Dash Price Prediction 2026: Expert View
According to CoinGabbar analysts, DASH's chart shows a real attempt to break a descending channel that's been in control since late July, backed by a sharp reclaim of both the EMA 20 and EMA 50 and a meaningful volume surge.
RSI at 62.55 reflects genuine momentum without being stretched yet.
The key question now is whether price can close above the channel trendline near $32.93 and hold there, since a rejection at this level would put the recent bounce back in question.
Dash Price Prediction: Data Sources
Price and RSI data referenced from a 4H $DASH/USDC chart on Coinbase via TradingView, timestamped August 1, 2026, 14:47 UTC+5:30. Market cap, volume, FDV, and supply data referenced from a CoinGecko-style market tracker, snapshot taken August 1, 2026.
Disclaimer: This piece is for informational purposes only and isn't financial advice. Crypto prices are volatile, and it's worth doing independent research before acting on any of the levels discussed here.
0
0

 Manage all your crypto, NFT and DeFi from one place
Securely connect the portfolio you’re using to start.

0
0

0
0

0
0

0
0