Daily Analysis: BTC, ETH, UNIBOT, MULTI, MXC
8M ago•

bullish:
1
bearish:
0
Share

Markets are riding on bear activity, with the global market cap sitting 1% below its previous 24-hour mark as the total cap stands at $1.02T as of press time. The fear and greed index is now at 32 as fear and greed index.
Bitcoin price analysis
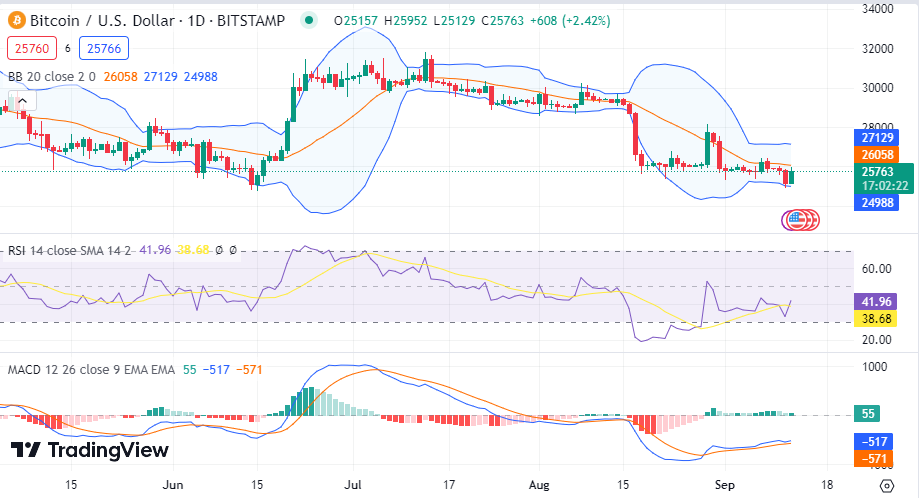
Bitcoin (BTC) has encountered minor bear activity, as Bitcoin price stands at $25.7K after recording a daily decrease of 0.32%, and the weekly rise now stands at 0.24%.As a result of the Bitcoin price, the token’s trade volume jumped by 112% during the same period and is presently at $17.8B.
The Bollinger bands are now moving at a close distance, showing low volatility levels on Bitcoin Price. The Relative Strength Index (RSI) is above the average line as bulls struggle for dominance as the MACD moves in the green zone showing some bull effect on Bitcoin price.
Ethereum price analysis
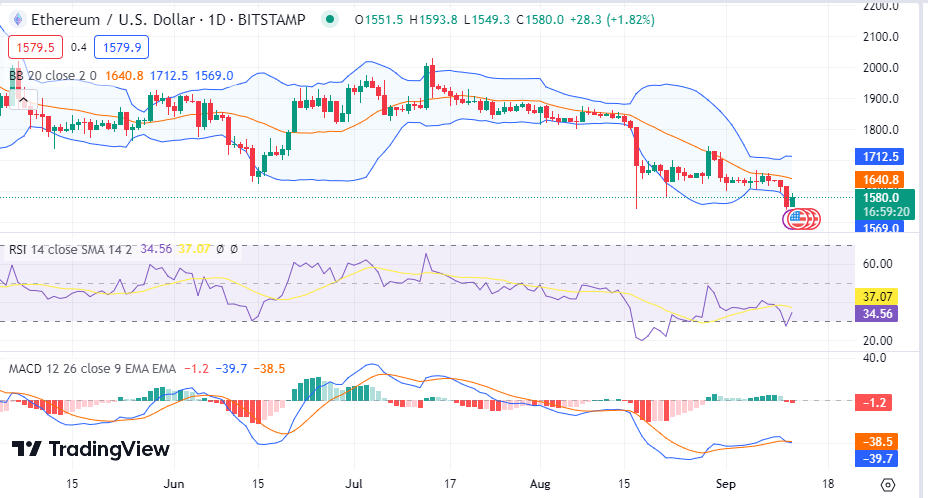
Ethereum (ETH) has also encountered bear activity, as Ethereum price stood at $1579 after recording a daily decrease of 2.2%, as the weekly drop now stands at 2.6%. ETH’s trade volume jumped by 91% during the same period and is presently at $8.6B.
The Bollinger bands are now diverging, showing increasing volatility levels on Ethereum price. The Relative Strength Index (RSI) is below the average line while the MACD moves in the red zone showing bear action on Ethereum price.
UniBot price analysis
UniBot (UNIBOT) has also encountered slight bull activity, as UniBot price stood at $69.65 after recording a daily increase of 0.42%, as the weekly drop now stands at 21.2%. ETH’s trade volume jumped by 106% during the same period and is presently at $14.5B.
The Bollinger bands are now diverging, showing increasing volatility levels on UniBot price. The Relative Strength Index (RSI) is below the average line while the MACD moves in the red zone showing some bear action on UniBot price.

Multichain price analysis
Multichain (MULTI) is also riding on bull activity, as Multichain price stood at $2.21 after recording a daily increase of 8.2%, as the weekly rise now stands at 46.3%. Multichain’s trade volume jumped by 152% during the same period and is presently at $83.3M.
The Bollinger bands are now diverging, showing increasing volatility levels on Multichain price. The Relative Strength Index (RSI) is above the average line close to the overbought region while the MACD moves in the green zone showing bull action on Multichain price.

MXC price analysis
MXC (MXC) has also encountered bull activity, as MXC price stood at $0.009574 after recording a daily increase of 6.2%, as the weekly rise also stands at 5.6%. MXC’s trade volume jumped by 143% during the same period and is presently at $11.9B.
The Bollinger bands are now diverging, showing increasing volatility levels on MXC price. The Relative Strength Index (RSI) is above the average line while the MACD moves in the green zone showing bull action on MXC price.

8M ago•
bullish:
1
bearish:
0
Share


 Manage all your crypto, NFT and DeFi from one place
Securely connect the portfolio you’re using to start.

bullish:
0
bearish:
0

bullish:
0
bearish:
0

bullish:
1
bearish:
0

bullish:
0
bearish:
0