
Pepe Price Prediction: Could PEPE Break Toward $0.0000055?

0
0

Weeks of sliding lower, and now PEPE has actually clawed some of it back. That reversal is what this Pepe Price Prediction is built around.
Pepe first showed up in 2023, a meme token riding the well-known internet frog, and it didn't take long to become one of the most traded names in that whole corner of the market.
Right now, the PEPE price today is $0.00000362, and it is up 0.8% today.
PEPE Live Market Data
Metric | Value |
Price | $0.00000362 |
Market Cap | $1.525B |
Fully Diluted Valuation | $1.525B |
24-Hour Trading Volume | $200.724M |
Circulating Supply | 420.69T |
Total Supply | 420.69T |
Max Supply | 420.69T |
Source: PEPE market data taken from CoinGecko, as of Sep 8, 2026. Figures may vary slightly across other tracking websites.
Liquidation Snapshot
Timeframe | Total Liquidated | Longs | Shorts |
1h | $119.49 | $0 | $119.49 |
4h | $50.97K | $49.26K | $1.71K |
12h | $150.85K | $134.98K | $15.87K |
24h | $218.12K | $180.55K | $37.57K |
Source: Liquidation Data Taken From CoinGlass, As of Sept 8, 2026
Zoom out to the 12-hour and 24-hour windows, and it's mostly long positions being liquidated, which fits with a market that's been grinding upward into resistance rather than swinging cleanly either way.
The one hour where shorts actually dominated was the most recent, and even then it's a tiny number, more of a hint that late sellers are starting to feel some pressure than anything decisive.
Exchange Volume
OKX is running the show on $PEPE futures right now, pulling in $101.47M over the past day.
MEXC isn't too far off at $81.15M. Below that, LBank sits at $28.40M and Bitget at $26.28M, with KuCoin adding another $22.33M. 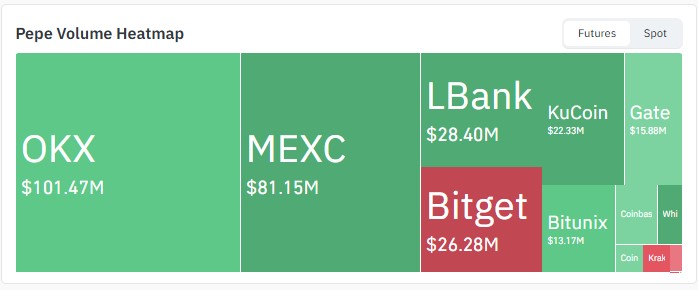
Source: Volume Heatmap Data Taken From CoinGlass, As of Sept 8, 2026
Gate and Bitunix bring up the rear at $15.88M and $13.17M, and whatever's left trickles through Coinbase, Kraken, and WhiteBIT in smaller amounts.
Pepe News Today: What Traders Are Watching
A Multi-Year Wedge Nears Its Apex
Trader Kamran Asghar flagged something bigger this week: a macro falling wedge that's been building on $PEPE's chart for years, and price is now compressing right near its apex. His take is straightforward. 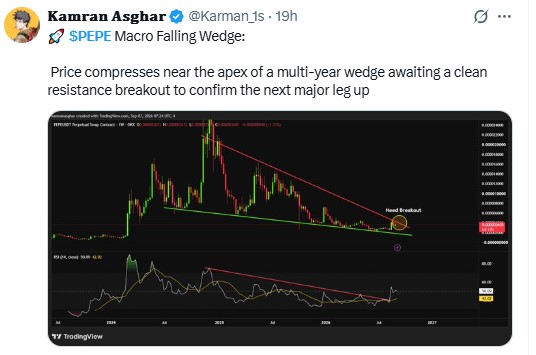
Source: Data Taken From @Karman_1s, X Account.
A clean break above the wedge's resistance line would be the confirmation signal for PEPE's next major leg higher.
It's a zoomed-out view, but it lines up with the shorter-term setup playing out on the daily chart below.
Pepe Price Prediction: Technical Outlook
Pull up the daily PEPE/USDT chart on Binance and you can see the shift clearly. Late August had a price stuck inside a descending channel, grinding lower day after day, until it finally broke above the channel's upper boundary.
Since then, $PEPE has been climbing inside a fresh ascending channel, and it's now knocking on resistance at the top of that structure. 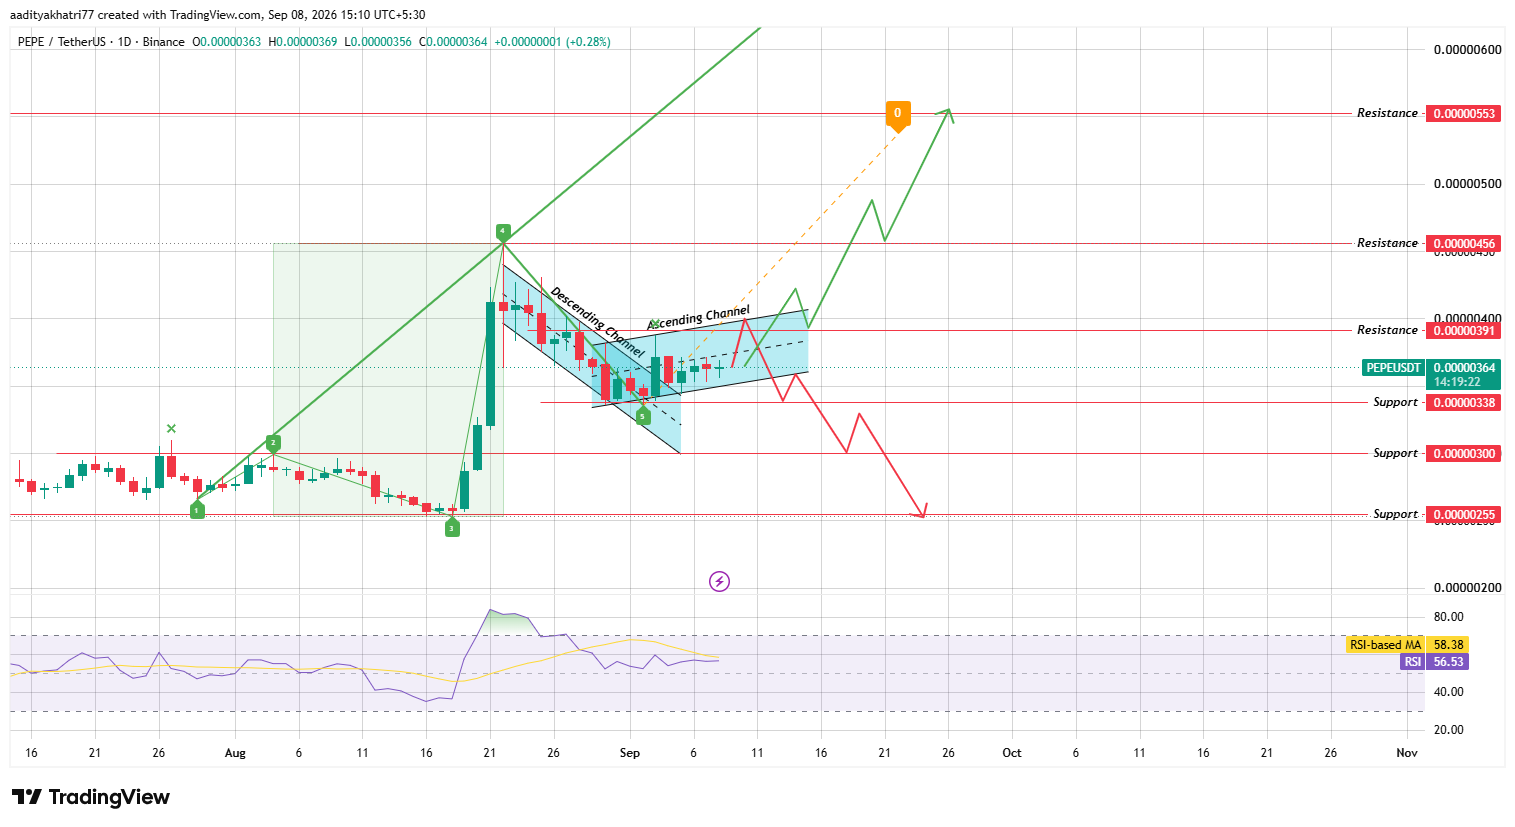
Source: Chart Taken From TradingView, as of Sep 8, 2026
RSI reads 56.53, just under its moving average of 58.38, which points to steady momentum without anything overheated.
There's also a Wolfe wave pattern on the chart, and it's projecting an upside target near $0.00000553, adding weight to the case for further gains if this resistance breaks.
Could PEPE Break Toward Higher Resistance?
Clear this resistance on a strong daily close with volume behind it, and $0.00000456 becomes the first stop.
Push past that too, and the path opens toward $0.00000553, which happens to be almost exactly where the Wolfe wave target sits.
What Happens If PEPE Gets Rejected From Resistance?
Flip it around. If sellers show up here and the price gets pushed back down through the ascending channel's lower boundary, $0.00000338 is the level that should catch it first.
Keep sliding past that, and $0.00000300 comes into play, with $0.00000255 as the next stop if the decline really extends.
Support and Resistance Levels
Support | Resistance |
$0.00000338 | $0.00000391 |
$0.00000300 | $0.00000456 |
$0.00000255 | $0.00000553 |
Bull, Base, and Bear Scenarios
Scenario | Setup | Level |
Bull | Daily close above channel resistance on volume | $0.00000456–$0.00000553 |
Base | Price consolidates near channel resistance | $0.0000036–$0.0000039 |
Bear | Rejection from resistance, break of channel's lower boundary | $0.00000338–$0.00000255 |
Glossary
Think of a descending channel as two parallel lines sloping downward, with price trapped between them, and a break above the top one is usually the first hint that sellers are running out of steam.
Flip that structure and you get an ascending channel, same idea, just climbing instead of falling.
The wolfe wave is a bit different: it's a five-point structure traders use to sketch out where price might land once the pattern wraps up.
RSI, on the other hand, is about speed; it clocks how fast and how far the price has moved recently, which is why it's handy for catching momentum shifts before the price itself gives the game away.
And support and resistance are just the zones where buyers or sellers have shown up often enough before to stop a move in its tracks, or turn it around entirely.
PEPE vs Bitcoin
Meme tokens tend to exaggerate whatever mood Bitcoin is already setting, and $PEPE is no exception.
Bitcoin sitting quiet lately hasn't stopped PEPE from carving out its own channel structure, but any sharper Bitcoin move, in either direction, usually shows up amplified in $PEPE given how much thinner its liquidity is by comparison.
Methodology
This Pepe Price Prediction draws on daily candlestick data from Binance, RSI readings, and the channel and wolfe wave structures that have shaped the chart since mid-August 2026.
The levels above are tied to specific breakout or rejection conditions, not promises, and price can always move in ways no chart pattern fully captures.
Expert Opinion
Traders following $PEPE's setup point out that flipping from a descending channel to an ascending one is often an early tell that a trend is turning, though it usually still needs a clean break of the next resistance level before it counts as confirmed.
Layer in the macro falling wedge; some are watching on the bigger timeframe, and the overall structure looks like it's building toward something decisive, even if which way it breaks still comes down to how this resistance test plays out.
Disclaimer: This Pepe Price Prediction is for informational purposes only and should not be treated as financial advice. Cryptocurrency markets are highly volatile, technical patterns can fail to play out as expected, and any of the scenarios described above carry a realistic probability of not occurring. Readers should conduct independent research before making any investment decisions.
0
0

 Manage all your crypto, NFT and DeFi from one place
Securely connect the portfolio you’re using to start.


