Solana (SOL) Breaching $150 Could Change SOL’s Course
14d ago•

bullish:
0
bearish:
0
Share

Solana’s (SOL) price is on the brink of breaking out of a bullish reversal pattern that could send the altcoin into a recovery rally.
This is only possible if the broader market cues keep volatility at a low and investors respond to SOL’s current value.
Solana Could See Growth
Solana’s price, currently trading at $139, forms a descending wedge that may soon break. This observation finds support in the Relative Strength Index (RSI), which gauges the speed and change of price movements.
Along with the RSI, the Moving Average Convergence Divergence (MACD), which indicates trend strength and potential reversals in an asset’s price, also notes bullishness.
Both the indicators are hinting at a rise with the RSI in the bullish zone above the neutral line at 50.0. MACD, at the same time, is observing a persisting bullish crossover, which could help SOL break the wedge.
Read More: How to Buy Solana (SOL) and Everything You Need To Know
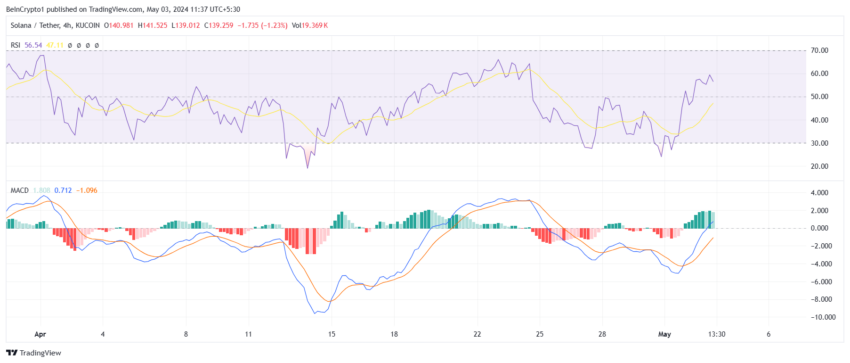 Solana RSI and MACD. Source: TradingView
This could translate to a rally since the altcoin is highly undervalued at the moment. This is derived from the P/S ratio against the revenue noted by the asset.
The Price to Sales (P/S) ratio establishes the value of an asset, with a low ratio implying undervaluation of the stock. Conversely, a ratio exceeding the average could suggest overvaluation of the stock.
Solana’s revenue has grown considerably in the past few months, with peaks registered in March. However, at the same time, the P/S ratio has been far lower than it was during low revenue periods in Q4 2023.
This is an indication that Solana has room to grow ahead of it.
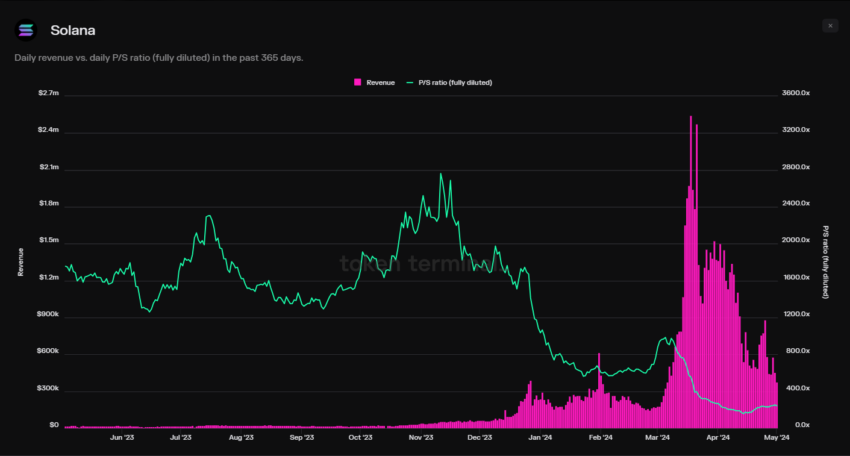 Solana P/S Ratio. Source: TokenTerminal
SOL Price Prediction: Awaiting a Breakout
For the past three weeks, Solana’s price has been stuck within a falling wedge. In this duration, this bullish pattern had been validated during the recent correction and recovery.
Characterized by converging trendlines sloping downward, a falling wedge forms a bullish chart pattern, which signals a potential reversal from a downtrend. It typically suggests decreasing selling pressure and potential price breakouts to the upside.
Considering the above-mentioned factors and SOL trading right under the upper trend line of the wedge, it is likely that the altcoin could break out soon. This would enable Solana to breach through the $142 resistance and reclaim $150 as a support floor.
Read More: How to Buy Solana (SOL) and Everything You Need To Know
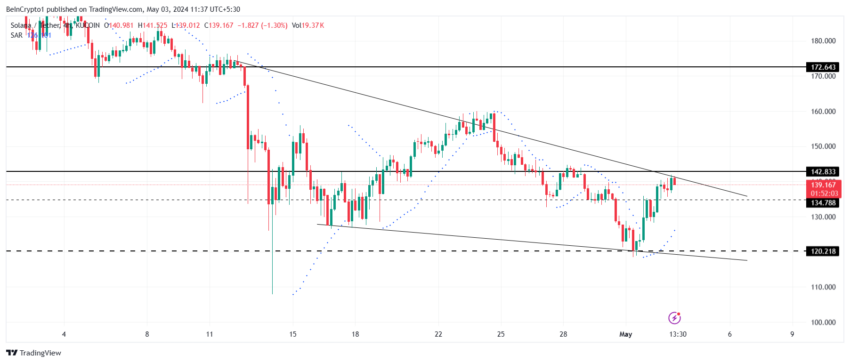 Solana Price Analysis. Source: TradingView
This crucial psychological level has been tested as resistance multiple times. A breakout above this level has resulted in a rally. Going forward, investors can anticipate the same this time around as well.
However, if the breach fails and SOL falls back down through $134, it could note a decline to $120. Losing this support would result in an invalidation of the bullish thesis, extending the correction to $110.
14d ago•
bullish:
0
bearish:
0
Share


 Manage all your crypto, NFT and DeFi from one place
Securely connect the portfolio you’re using to start.

bullish:
0
bearish:
0

bullish:
0
bearish:
0

