
Cardano Price Prediction: Can ADA Achievement News Push $ADA to $0.5

0
0
Cardano price prediction interest is climbing again as ADA works through a two-stage chart story that traders have been watching closely.
After breaking free of a falling channel that had kept price under pressure for weeks, ADA has now moved into a tighter ascending triangle and is currently trading right around the support side of that structure.
A coin that clears one bearish pattern only to sit right on the edge of another decision point tends to draw exactly this kind of attention.
Here is the complete picture of where ADA stands right now.
Disclosure: This article is for informational purposes and reflects independent chart analysis. Neither the author nor CoinGabbar holds a position in ADA at the time of writing.
ADA Price Today: Live Data and 24-Hour Change
ADA is trading at $0.216 as of this writing, down 1.68% on the day after slipping roughly $0.0037, a mild pullback given how much ground the token has covered in recent weeks.
Futures volume over the past 24 hours sits at $597.94 million against spot volume of $106.20 million, showing that leveraged traders are driving the bulk of today's price action around this level.
Cardano's market cap currently stands at $7.96 billion, with open interest at $461.19 million, a moderate amount of leverage that leaves some breathing room before the market gets overheated in either direction.
Circulating supply is 36.73 billion ADA against a total supply of 44.99 billion and a max supply of 45 billion, meaning the vast majority of ADA's eventual supply is already circulating, a detail worth factoring into any longer-term Cardano price outlook.
Source: CoinGlass, ADA market data, accessed September 8, 2026.
Cardano Latest News: Supply Chain Certificates Anchored On-Chain
This is the Cardano news update worth pairing with today's chart.
According to a post from BSCN on X, Blockforce has anchored proof of 500,000 supply chain certificates on Cardano.
The post referenced a case study published by the Cardano Foundation showing that supplier identities, contract terms, and production volumes are kept on a permissioned Hyperledger Fabric network, with Cardano used to anchor verifiable proof of those records on-chain.
Real-world use cases like this one, tying physical supply chain data to on-chain verification at a scale of half a million certificates, are the kind of development that regularly finds its way into longer-term Cardano trend analysis, since they point to actual enterprise adoption rather than pure speculation.
Whether this specific integration moves the needle on price in the short term is uncertain, but it adds another data point to the broader ADA price outlook.
Source: Post by BSCN (@BSCNews) on X.
Quick Take: ADA Price Action At A Glance
CMP: $0.2159 (4-hour chart, Binance)
Price has broken out of a descending channel and is now trading inside an ascending triangle, currently sitting near the support side of that structure
4-hour trigger: a close above $0.2338 confirms a triangle breakout, opening the path toward $0.2587, then major resistance at $0.3575
Failure level: a close below $0.1888 would mark the triangle breakout as failed and shift focus to the next support at $0.1709
Momentum oscillator reading 49.43, sitting almost exactly at the neutral midpoint, reflecting the indecision at this stage of the pattern
Data timestamp: September 8, 2026, 4h Binance perpetual chart
Risk note: with momentum this neutral, the direction of the next confirmed close matters more than usual for this setup
ADA Technical Analysis
Looking at the 4-hour Cardano to TetherUS perpetual chart on Binance, ADA spent an extended stretch declining inside a well-defined descending channel before finally breaking out of that structure to the upside.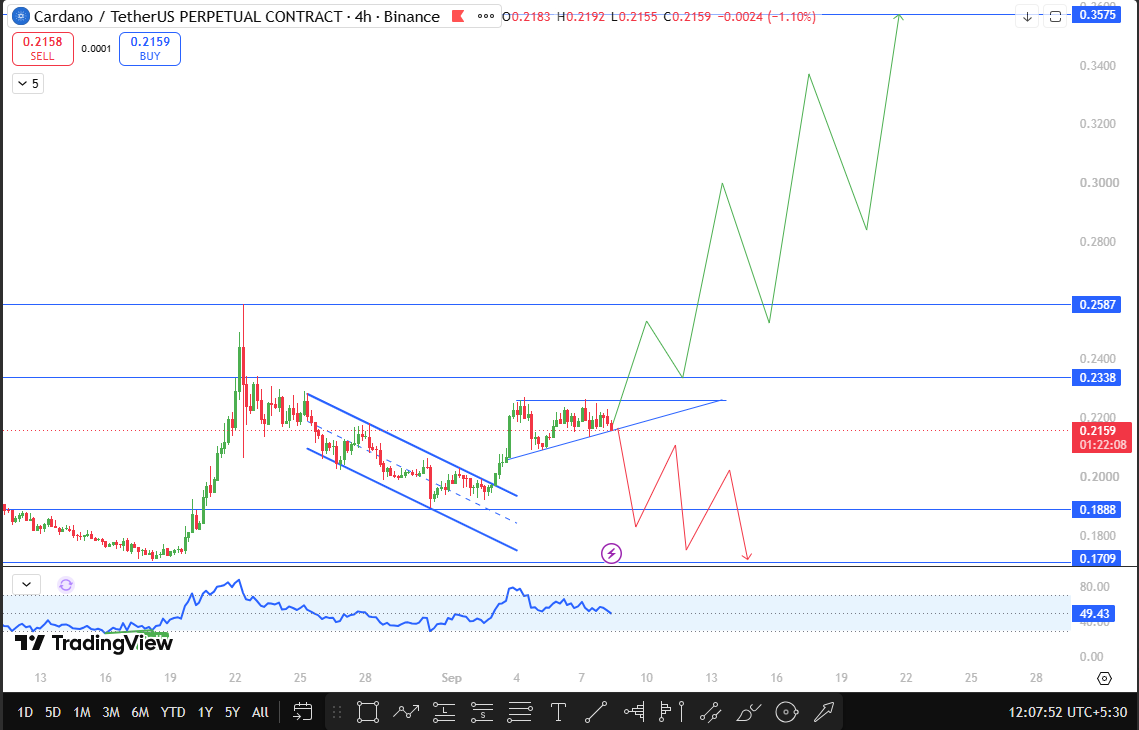
Since that breakout, price has moved into a tighter ascending triangle and is currently trading right around the support trendline of that new pattern, which puts this chart at a fairly clean decision point for anyone building a fresh ADA technical analysis.
The momentum oscillator is currently reading 49.43, essentially sitting right on the neutral line, which lines up with the sense that the market has not yet committed firmly to either resolving the triangle upward or breaking it down.
That kind of balanced reading right at a support test is often the calm before the next real move, though it gives no strong lean on its own.
The level to watch on the upside is $0.2338. A 4-hour close above this zone would confirm a genuine breakout from the ascending triangle, and that would open the path toward $0.2587 as the next resistance target.
Beyond that, the major resistance sits at $0.3575, a level that would only come into serious focus if this broader recovery structure keeps building the way the chart currently suggests it could.
On the downside, if ADA instead closes a 4-hour candle below $0.1888, that would mark this triangle breakout attempt as a failure rather than a continuation setup.
In that case, the next support to watch is $0.1709, a level that would likely draw renewed buying interest if sellers manage to push the price down that far.
Source: TradingView, ADA/USDT Perpetual, Binance, 4h chart, accessed September 8, 2026, 12:07 UTC+5:30.
ADA Support And Resistance Levels To Watch
Level Type | Price | Distance From CMP |
Major Resistance | $0.3575 | +65.6% |
Resistance 1 | $0.2587 | +19.8% |
Resistance 0 (Triangle Breakout Trigger) | $0.2338 | +8.3% |
Current Price | $0.2159 | — |
Support 1 (Failure Trigger) | $0.1888 | -12.6% |
Major Support | $0.1709 | -20.8% |
Bull Case, Base Case, And Bear Case For ADA
The bullish case here builds on ADA already having cleared its descending channel.
If the price now closes above $0.2338 and confirms the ascending triangle breakout, $0.2587 becomes the next logical target, and a continuation with real momentum behind it could eventually put $0.3575 in play further out, especially with enterprise adoption stories like the Blockforce certification adding a steady stream of positive Cardano news in the background.
The base case has ADA continuing to trade around this triangle support for a bit longer, particularly with momentum sitting so close to neutral.
Some additional sideways chop between $0.1888 and $0.2338 while the market waits for a confirmed close in either direction would not be surprising at all.
The bearish scenario shows up if ADA closes below $0.1888. That would confirm the triangle breakout has failed, and the more likely path from there would be a slide toward $0.1709, particularly if broader crypto sentiment weakens at the same time this support gives way.
Risks To This Cardano Price Prediction
A breakout from one bearish pattern does not guarantee a clean move through the next resistance pattern, and there is no certainty this ascending triangle resolves upward simply because the prior channel did, so treating $0.2587 as a given would be premature.
The neutral momentum reading also means this setup could chop sideways longer than expected before committing to a direction, testing patience on both sides.
Broader crypto market sentiment remains a factor too, since a shift in risk appetite across Bitcoin or the wider altcoin space could easily override this triangle setup regardless of how the on-chain adoption story develops.
Key Terms Explained
Ascending Triangle: A price pattern formed by a flat or rising support line and a flat resistance line converging together, typically resolving with a breakout in the direction of the prevailing trend.
Descending Channel: A price pattern formed by two parallel downward sloping lines, with price moving between them until it eventually breaks out above or below the structure.
Open Interest: The total value of outstanding derivative contracts that remain unsettled, often used as a gauge of how much leveraged money is active in a market.
Disclaimer
This article is for informational purposes only and should not be taken as financial advice. Cryptocurrency markets are highly volatile, and price predictions are based on technical analysis that can change quickly with new market developments. Always conduct your own research before making any investment decisions.
0
0

 Manage all your crypto, NFT and DeFi from one place
Securely connect the portfolio you’re using to start.


