Litecoin Price Risks Breakdown to $28, But Bullish Wedge Offers One Last Hope

0
0


NOIDA (CoinChapter.com) — Litecoin (LTC) price fell sharply to $65 in early April, plunging nearly 7.5% on the week, as the broader crypto market reeled from a sudden and violent sell-off. The collapse wiped billions off the market cap, pulling Bitcoin (BTC) below $75,000 and dragging altcoins into deep red territory.
The root cause appeared to be a combination of macro and internal crypto market factors. Rising U.S. bond yields and fading rate-cut expectations reignited risk-off sentiment across global markets. Meanwhile, large outflows from Bitcoin spot ETFs further spooked retail and institutional investors.
Within this backdrop, Litecoin once again confronted its long-term nemesis—the 200-week exponential moving average (EMA), which rejected its price near $88 in July 2023. Historically, LTC’s interactions with this EMA have marked major turning points, making the current setup especially crucial.
Litecoin’s price structure has also stayed within a long-term ascending channel, giving bulls a last line of defense. At the same time, fractal-based projections using past EMA rejection events suggest three possible outcomes, each with drastically different price targets. The upcoming weeks will determine whether history repeats or diverges.
Can Litecoin Price Defend Its Last Bullish Structure?
Litecoin’s weekly chart reveals a recurring pattern: sharp rejections from the 200-week EMA, each followed by distinctly different price trajectories. The chart visualizes three such instances. The first occurred in Nov. 2018, when LTC faced a firm rejection and entered a prolonged accumulation phase.
The subsequent recovery unfolded gradually over the next two years. The projection based on this fractal (marked in purple) forecasts a moderate rise toward $116 by December 2025, matching the upper-mid range of the current ascending channel.
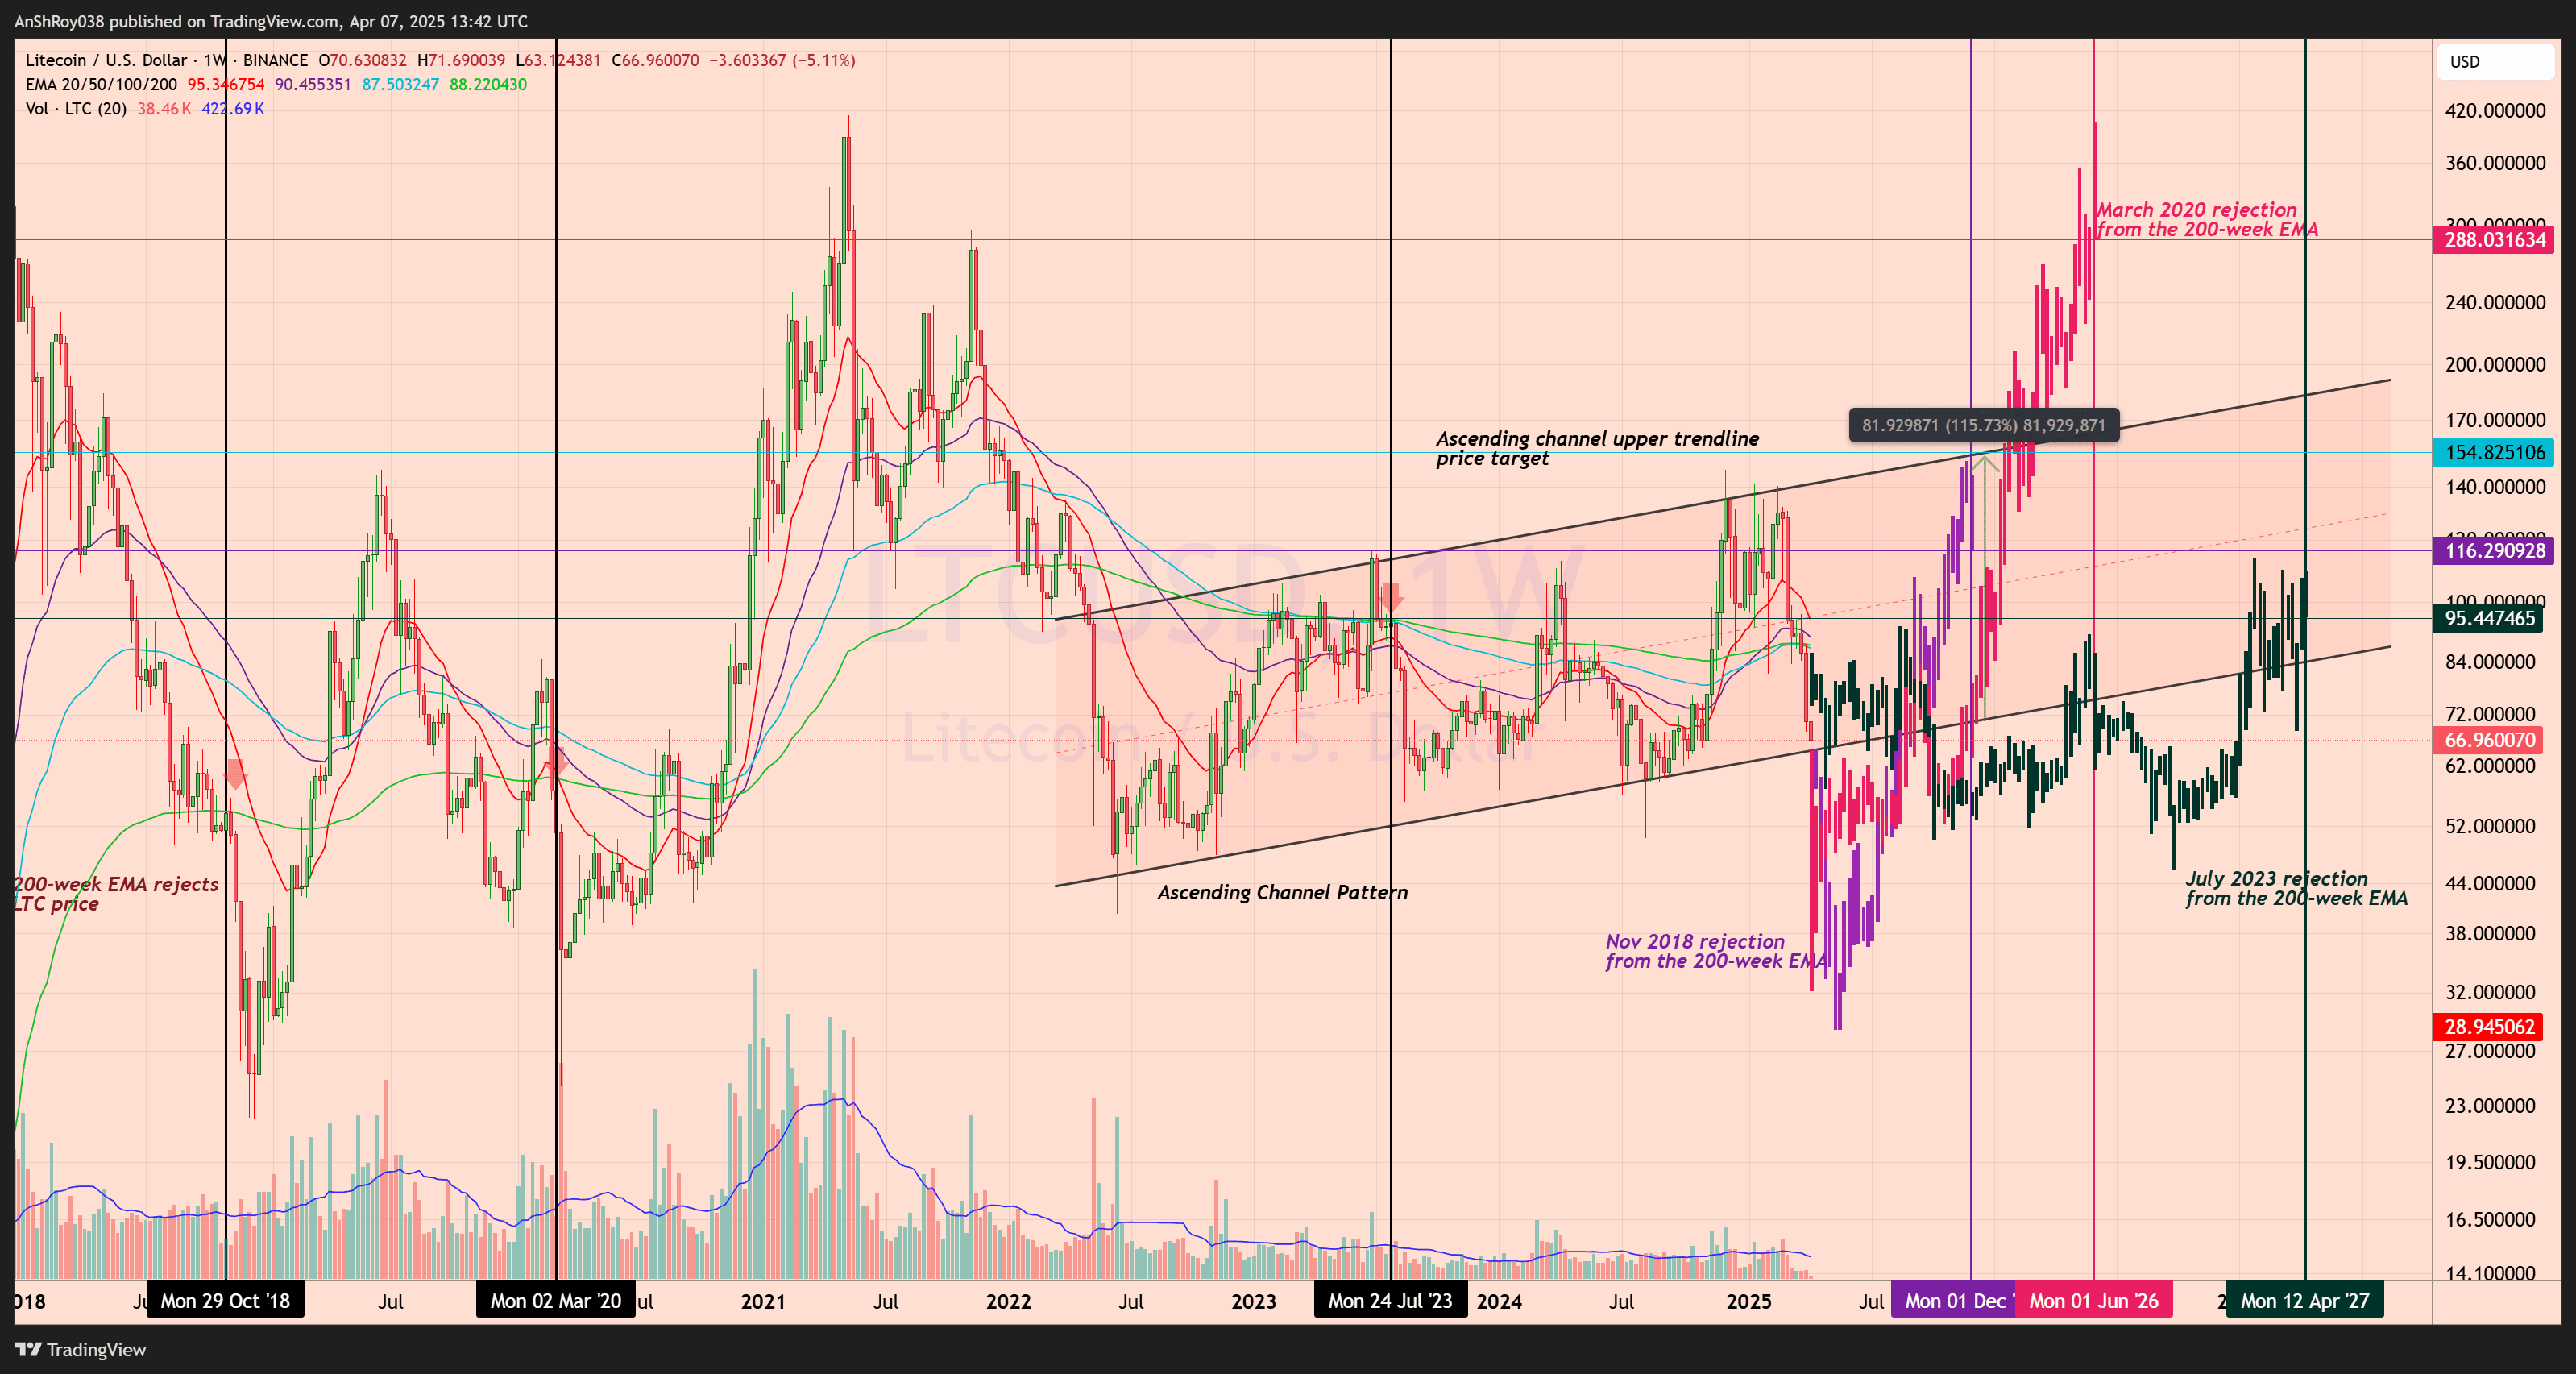
The second rejection came in March 2020, just as global markets crashed during the onset of the COVID-19 pandemic. However, this event became a launchpad for Litecoin, surging over 115% in the following weeks, and finally ending up with 1,320% rally to its ATH in 2021.
The corresponding projection (shown in pink) envisions an aggressive breakout toward $288 by June 2026. The target significantly overshoots the current range and would require a major market-wide rally to validate.
The most recent rejection from the 200-week EMA occurred in July 2023 and now serves as the base for the ongoing price projection (highlighted in dark green). If this path repeats, Litecoin could climb modestly toward $95. However, LTC is still trading within a long-term ascending channel, which forms the critical context for these projections.
The channel’s upper boundary is around $155, aligning with previous bull market peaks and potential resistance zones. So far, the channel’s lower boundary has held, offering a final support structure for bulls.
If that level fails, Litecoin could descend toward $28, a long-standing demand zone, highlighted in red. This would confirm a full structural breakdown. Traders now face a binary setup — reclaim the EMA, retest upper resistance, or spiral toward historical lows.
LTC Holds Key Support, Stays Inside Bullish Wedge as RSI Signals Potential Reversal
Meanwhile, the Litecoin price continues to trade within a falling wedge pattern, a setup traditionally known for bullish breakouts. The wedge has developed over several months and is defined by two downward-sloping trendlines that converge into a narrowing range.
In early April, LTC tested the lower boundary of this wedge near the $63 support level and held firm. This bounce came as selling volume spiked and the daily RSI dipped into oversold territory. Now hovering near 26, it signals a potential reversal in momentum.
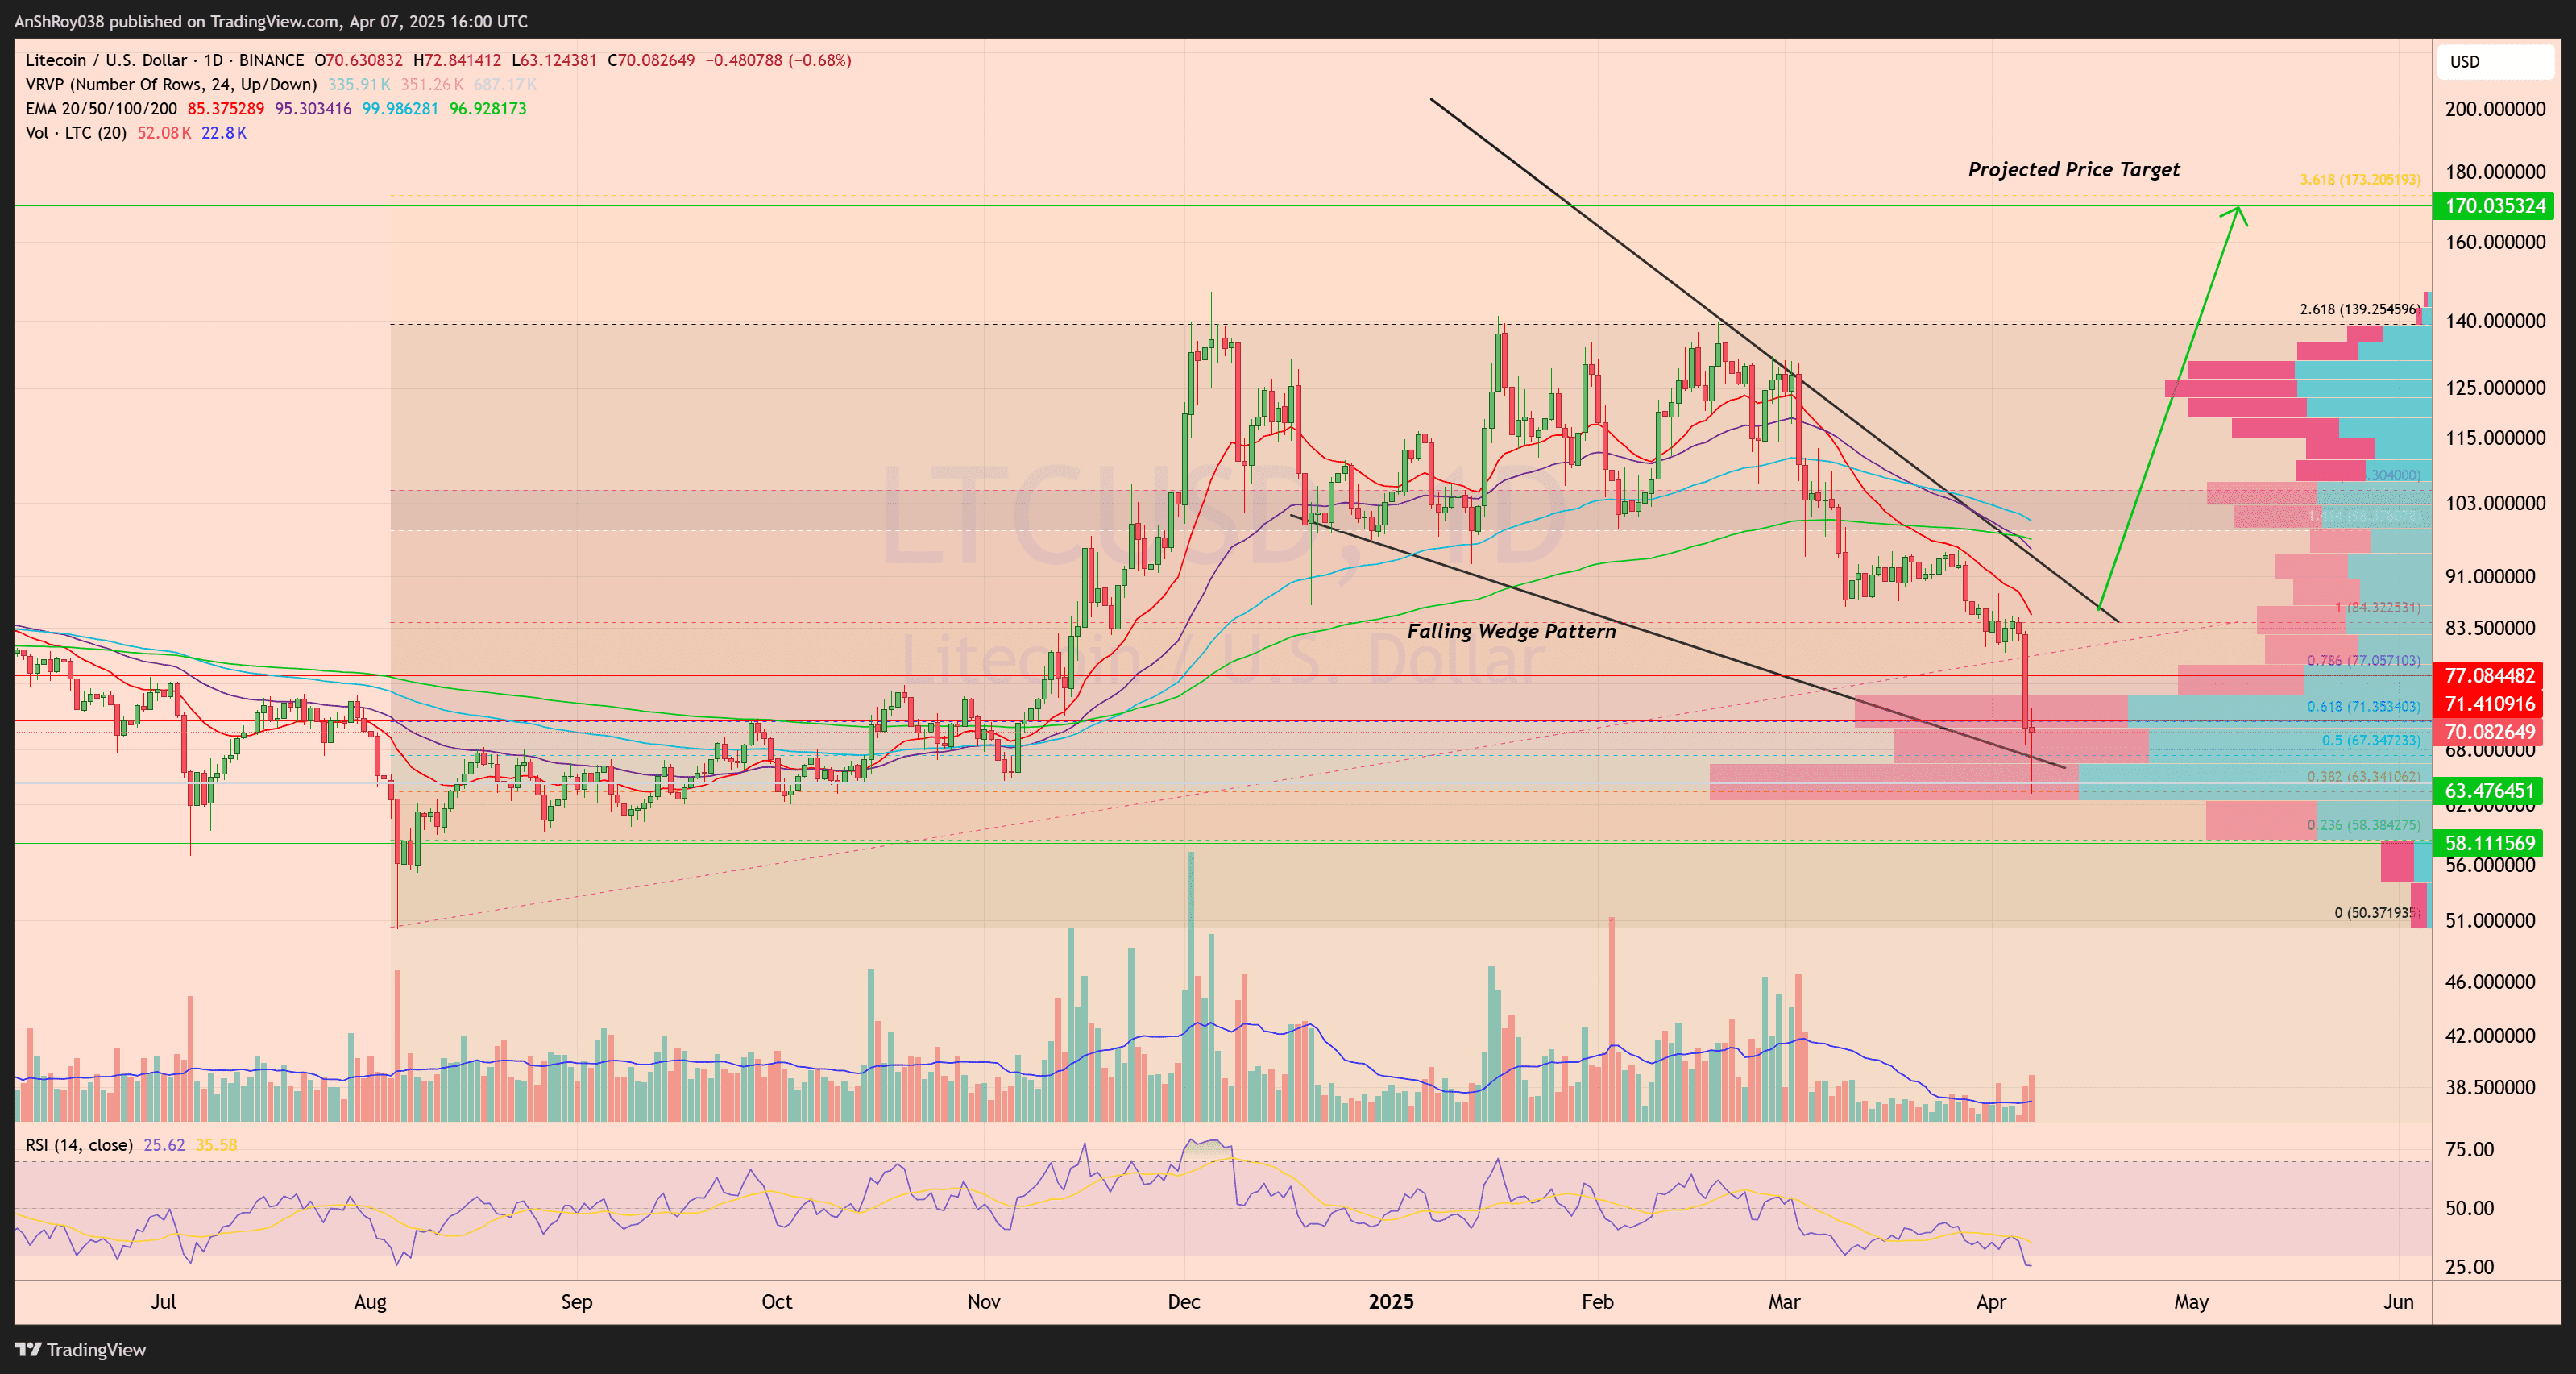
The falling wedge remains intact, and the structure favors a bullish outcome if confirmed by a breakout above the upper trendline. Immediate resistance rests near $71, marked by the 0.618 Fib level. Flipping the immediate resistance would target the resistance near $77, where the 0.786 Fib extension and historical volume node converge.
Beyond that, the setup projects a potential move toward $139, with the wedge pattern breakout scenario pointing to a theoretical price target near $170.
On the downside, LTC has strong support near $63, followed by a key horizontal level around $58, which aligns with the 0.236 Fib retracement and a high-volume node. A breakdown below these levels would invalidate the bullish wedge.
Until then, Litecoin holds within a technically favorable structure that has not yet broken down. Bulls must defend the current level and force a breakout to reclaim short-term momentum.
0
0


 Manage all your crypto, NFT and DeFi from one place
Securely connect the portfolio you’re using to start.


0
0
