Crypto Price Analysis: BTC, ETH, TON, OP, and WLD Give Mixed Signals
13d ago•

bullish:
0
bearish:
0
Share

In the wake of a tumultuous week, the crypto market witnessed a remarkable resurgence over the weekend, signaling a potential shift in sentiment. As the market grapples with recent fluctuations, major cryptocurrencies including Bitcoin (BTC), Ethereum (ETH), Toncoin (TON), Optimism (OP), and Worldcoin (WLD) now stand at a pivotal juncture, offering a mosaic of signals to investors and enthusiasts alike.
With the global crypto market cap currently resting at $2.36 trillion, a mere 0.27% decrease from the previous day, and a total volume of $50.43 billion recorded over the last 24 hours, the landscape appears ripe for analysis. Notably, the dominance of stablecoins, accounting for 90.17% of the total crypto market volume, underscores a cautious yet resilient market sentiment.
Bitcoin (BTC) Price Analysis
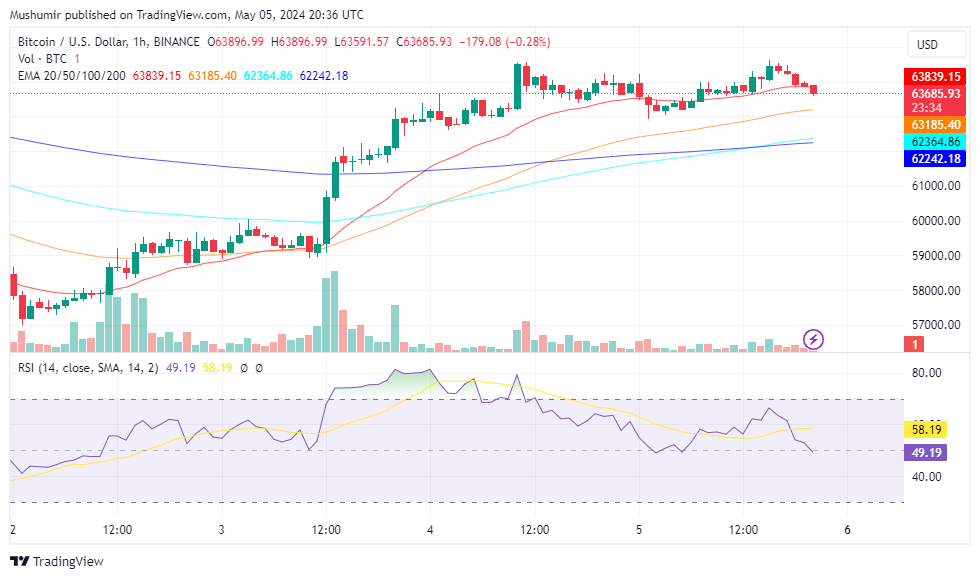
Bitcoin is currently navigating a consolidation phase, maintaining a price level of approximately $63,755 after experiencing a slight dip of 0.46% in the last 24 hours. This consolidation occurs within the broader market context, where Bitcoin has encountered notable resistance near the $64,000 threshold. The trading volume for BTC has seen a significant decline, down by 21.01% to $18.39 billion over the same period.
Such a reduction in trading activity often precedes significant price shifts, indicating a potential period of indecision or accumulation among market participants. Analyzing Bitcoin’s daily chart reveals a pattern of price fluctuation within a narrow range, reflective of recent market conditions. Despite this, Bitcoin remains within crucial technical boundaries, with the 200-day Exponential Moving Average (EMA) providing robust support beneath the current price.
This suggests a persistent bullish sentiment among investors, with the EMA acting as a significant level of support. However, Bitcoin faces a notable challenge in overcoming immediate resistance around the $64,200 mark. Breaking above this level could pave the way for further upward momentum. The Relative Strength Index (RSI) stands at 49.19 on the daily chart, indicating a neutral position. This suggests a delicate balance between bullish and bearish sentiments, with neither side currently holding a decisive advantage.
Ethereum (ETH) Price Analysis
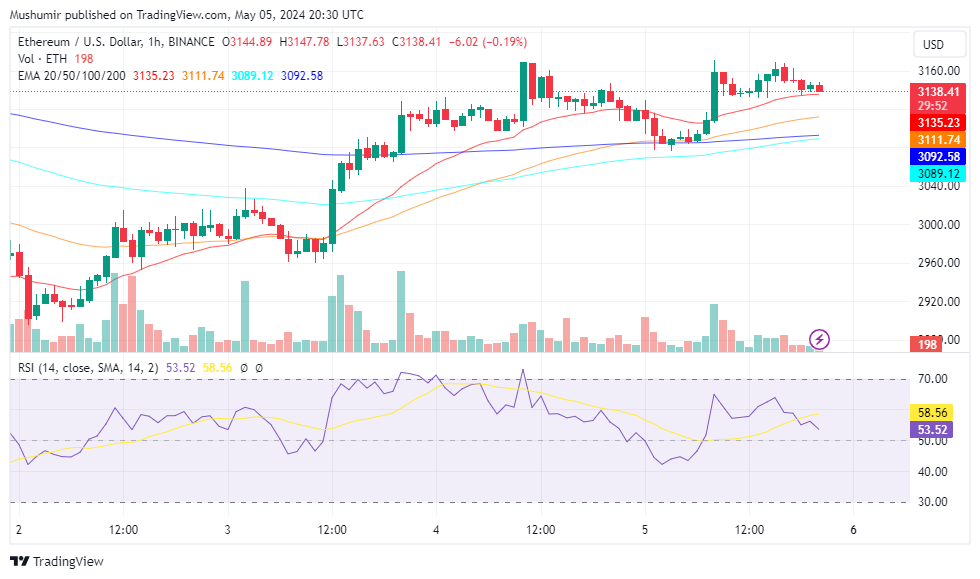
Ethereum has exhibited a relatively stable trend over the past 24 hours, with a marginal decrease of 0.08% in its price, now resting at $3,137. Despite this minor dip, the overall sentiment remains cautiously optimistic, as indicated by the Relative Strength Index of 53.52, suggesting a slight bullish bias in the market sentiment.
However, it’s essential to note that the trading volume for Ethereum has decreased slightly by 0.01% in the last 24 hours, amounting to $8.89 billion. This decrease could suggest a temporary lack of significant trading activity or investor interest. One positive indicator supporting the bullish sentiment is that Ethereum’s price is currently trading above its 200-day Exponential Moving Average.
This suggests that the long-term trend for Ethereum remains positive, as it indicates that the average price over the last 200 days is lower than the current market price. This alignment typically signals a bullish market sentiment among investors and traders. However, it is essential to monitor market developments and trading activity closely for any shifts in sentiment or significant price movements.
Toncoin (TON) Price Analysis

Toncoin has demonstrated a notable positive movement over the last 24 hours, with its price increasing by 2.02% to reach $5.87. This uptrend signals renewed investor interest and potential buying activity in the Toncoin market. However, despite the price increase, the trading volume for TON has decreased by 5.18% over the same period, amounting to $184.5 million. This decline in trading volume suggests a slight decrease in overall market activity, which could indicate a temporary pause in trading or investor caution.
The RSI for TON is currently at 61.03, indicating a more bullish sentiment among investors. This level suggests that Toncoin may be slightly overbought in the short term, but it also reflects positive market momentum. Furthermore, Toncoin’s price is trading above its 200-day EMA, which is considered a bullish sign. This indicates that the average price over the last 200 days is lower than the current market price, suggesting a positive long-term trend for Toncoin.
Overall, Toncoin has experienced a notable price increase over the last 24 hours, accompanied by a decrease in trading volume. The bullish sentiment is reinforced by the RSI indicating increased buying pressure and the price trading above its 200-day EMA. However, it is important to remain vigilant and monitor market developments closely for any potential shifts in the market sentiment.
Optimism (OP) Price Analysis
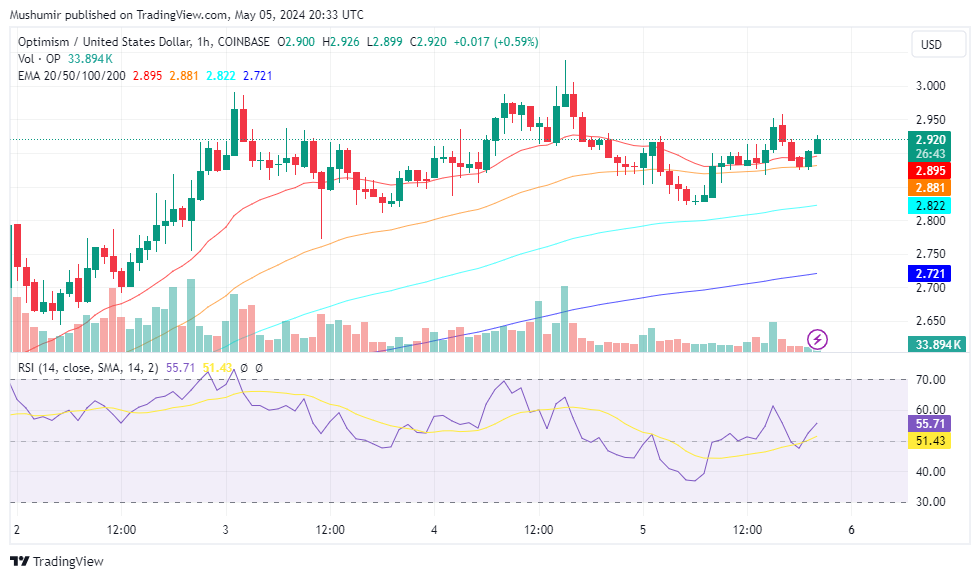
Optimism has experienced a slight decrease in price over the last 24 hours, with a decline of 0.22%, bringing its current price to $2.92. This modest downtrend may indicate a temporary pause in the recent price appreciation or profit-taking by investors. Accompanying the price decline is a significant decrease in trading volume, down by 27.19% to $242.16 million over the same period. This decline in trading activity suggests reduced market participation, potentially leading to increased price volatility or uncertainty.
Despite the price decrease and lower trading volume, the RSI for OP stands at 55.71, indicating a relatively bullish sentiment among investors. This suggests that there is still buying interest in Optimism, albeit at a slightly lower level compared to the recent past. Additionally, Optimism’s price continues to trade above its 200-day Exponential Moving Average, signaling a bullish long-term trend.
This indicates that the average price over the last 200 days is lower than the current market price, which could attract further buying interest from investors seeking opportunities in the cryptocurrency market. In the end, while Optimism has experienced a slight decrease in price and a significant drop in trading volume over the last 24 hours, the overall sentiment remains mildly bullish, supported by the RSI and the price trading above its 200-day EMA.
Worldcoin (WLD) Price Analysis
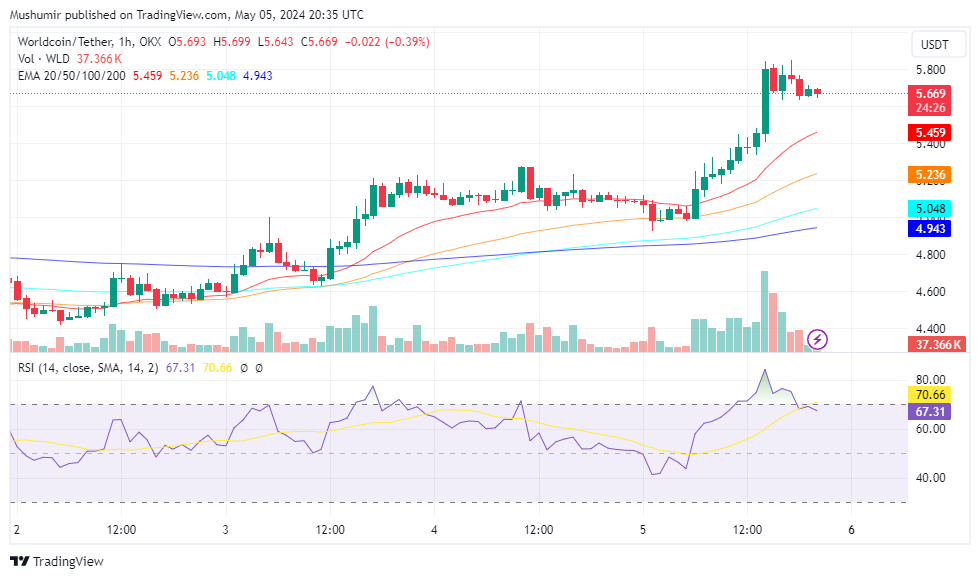
Worldcoin has exhibited a remarkable surge in price over the last 24 hours, recording an impressive increase of 10.76% to reach $5.66. This substantial uptrend reflects strong buying pressure and renewed investor interest in the Worldcoin market. Accompanying the price surge is a significant rise in trading volume, up by 56.43% to $384.8 million within the same period.
This surge in trading activity suggests heightened market participation and increased demand for Worldcoin, potentially indicating a shift in sentiment toward bullishness. However, it’s important to note that the RSI for WLD is currently at 67.11, indicating not only a bullish sentiment but also a slightly overbought condition.
An RSI above 70 typically suggests that an asset may be overbought, which could potentially lead to a price correction or consolidation in the near term. Despite the overbought condition, Worldcoin’s price is trading above its 200-day EMA, which is considered a bullish sign. This indicates a positive long-term trend for Worldcoin, as the current market price is higher than the average price over the last 200 days.
13d ago•
bullish:
0
bearish:
0
Share
 Manage all your crypto, NFT and DeFi from one place
Securely connect the portfolio you’re using to start.

bullish:
0
bearish:
0

bullish:
0
bearish:
0

bullish:
0
bearish:
0

bullish:
0
bearish:
0