
Mantle (MNT) Price Prediction 2026–2030: Can MNT Hit $1.00?

0
0

What to Know
- MNT broke above its descending trendline while a second bullish RSI divergence strengthened indications that selling pressure may be losing momentum.
- The 20-day EMA near $0.4115 provides immediate support, while reclaiming the 50-day EMA at $0.4433 could strengthen the recovery.
- Mantle’s Super Portal expansion to Solana increases its cross-chain reach, potentially supporting MNT demand as its capital markets infrastructure develops further.
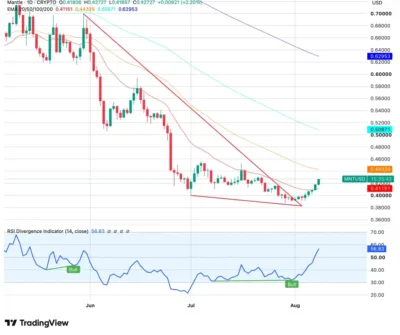
Mantle (MNT) is showing signs of a potential technical recovery after breaking above the descending trendline that had restricted price advances since the May peak. MNT traded around the $0.42 area following the breakout, while its Relative Strength Index (RSI) climbed to approximately 56.83, moving above the neutral 50 level and signaling improving momentum.
The breakout also coincides with a second bullish RSI divergence, strengthening the possibility that the prolonged decline is losing momentum. However, several important exponential moving averages remain overhead, meaning buyers still need additional confirmation before the broader market structure can turn decisively bullish.
Mantle’s expanding cross-chain infrastructure could also influence its longer-term outlook, particularly following the launch of the Super Portal on Solana, secured through Chainlink’s Cross-Chain Interoperability Protocol (CCIP).
Also Read: Collect on Fanable (FAN) Price Prediction 2026–2030: Can FAN Hit $0.100?
Bulls Challenge the 50-Day EMA Resistance
MNT has broken above the descending trendline connecting a series of lower highs formed between June and July. Price also reclaimed the 20-day EMA around $0.4115, transforming the level into the first important support zone for the developing recovery.
The next major obstacle sits around the 50-day EMA at $0.4433. A sustained daily close above this level could provide additional confirmation that buyers are regaining control and potentially open the path toward the 100-day EMA at $0.5087.
Further upside would bring the 200-day EMA around $0.6295 into consideration. Conversely, losing $0.4115 could weaken the breakout structure and expose the psychological $0.40 level, followed by the July low near $0.38.
Technical Outlook
MNT’s RSI reading of approximately 56.83 has moved above the neutral 50 level, indicating that buying momentum has strengthened. More importantly, the chart has produced two bullish RSI divergences, with the latest divergence accompanying the trendline breakout.
August seasonality provides a mixed backdrop. MNT has historically averaged a 9.27% return during August, although the historical median stands at -2.34%. The token gained 58.1% during August 2025 but declined 16.3% and 13.6% during the same month in 2024 and 2023, respectively.
MNT has gained approximately 8.91% during August 2026. Maintaining support above $0.4115 while clearing $0.4433 could strengthen the case for a move toward $0.5087 and potentially $0.6295.
Source: Tradingview
MNT Price Prediction (2026–2030)
| Year | Minimum | Average | Maximum |
|---|---|---|---|
| 2026 | $0.38 | $0.51 | $0.63 |
| 2027 | $0.45 | $0.65 | $0.85 |
| 2028 | $0.55 | $0.78 | $1.00 |
| 2029 | $0.65 | $0.92 | $1.20 |
| 2030 | $0.75 | $1.10 | $1.45 |
Price Forecast by Year
2026
MNT could trade between $0.38 and $0.63 as buyers attempt to establish the recent trendline breakout as a sustainable recovery. Reclaiming the 100-day EMA at $0.5087 would strengthen the bullish structure and place the 200-day EMA near $0.6295 within reach.
2027
Greater adoption of Mantle’s cross-chain infrastructure could support MNT toward an average price near $0.65, while stronger cryptocurrency market conditions may allow the token to challenge the $0.85 region.
2028
MNT could approach the important $1.00 psychological level if Mantle expands its capital markets infrastructure across additional blockchain ecosystems and attracts greater liquidity through its cross-chain products.
2029
Continued ecosystem expansion, improving market liquidity, and stronger demand for Mantle-based assets could support an advance toward $1.20, although broader cryptocurrency market conditions would remain an important factor.
2030
Under a bullish long-term scenario, MNT could trade toward $1.45 if adoption strengthens and Mantle establishes a larger role across decentralized finance and blockchain-based capital markets.
Super Portal Expansion Strengthens Mantle’s Ecosystem
Mantle launched its Super Portal on Solana on August 6, with the integration secured by Chainlink CCIP. The infrastructure allows capital deployed through Mantle to reach additional blockchain ecosystems rather than remaining confined to one network.
Solana represents the Super Portal’s first external blockchain integration, with additional networks expected to follow. The expansion gives Mantle access to Solana’s liquidity base while allowing users to interact with Mantle-related assets without abandoning their preferred ecosystem.
Mantle has also been identified alongside Arbitrum, Linea, Starknet, and ZKsync among prominent Ethereum Layer 2 networks, with TVL, decentralized applications, governance, and ecosystem development remaining important competitive factors.
Conclusion
MNT’s technical outlook has improved following the descending trendline breakout, with the second bullish RSI divergence and RSI recovery above 50 supporting the developing bullish structure. However, resistance from the major moving averages means further confirmation remains necessary.
The $0.4433 level represents the immediate test, while a successful breakout could place $0.5087 and $0.6295 within reach. Over the longer term, continued expansion of Mantle’s cross-chain infrastructure could strengthen the possibility of MNT eventually challenging the $1.00 psychological level, although failure to maintain $0.4115 would increase downside risk toward $0.40 and $0.38.
FAQs
1. Is MNT currently bullish?
MNT is showing improving bullish momentum after breaking its descending trendline and reclaiming the 20-day EMA, although major resistance levels remain overhead.
2. What does the RSI indicate?
The RSI near 56.83 indicates improving buying momentum, while the second bullish RSI divergence provides additional technical support for the developing recovery.
3. What are MNT’s major resistance levels?
Immediate resistance sits near $0.4433, followed by the 100-day EMA at $0.5087 and the 200-day EMA around $0.6295.
4. Can MNT reach $1.00?
MNT could challenge $1.00 under a longer-term bullish scenario if Mantle expands adoption, cross-chain liquidity grows, and broader cryptocurrency conditions remain supportive.
5. What risks could limit MNT’s upside?
Failure to hold $0.4115, rejection from major moving averages, weak cross-chain adoption, and broader cryptocurrency market weakness could limit MNT’s recovery.
Also Read: Cronos (CRO) Price Prediction 2026–2030: Can CRO Hit $0.100?
The post Mantle (MNT) Price Prediction 2026–2030: Can MNT Hit $1.00? appeared first on 36Crypto.
0
0


 Manage all your crypto, NFT and DeFi from one place
Securely connect the portfolio you’re using to start.

0
0

0
0

0
0

0
0