
Pepe Crypto Bounces on Fear-Driven Market, but Daily Chart Stays Bearish

0
0

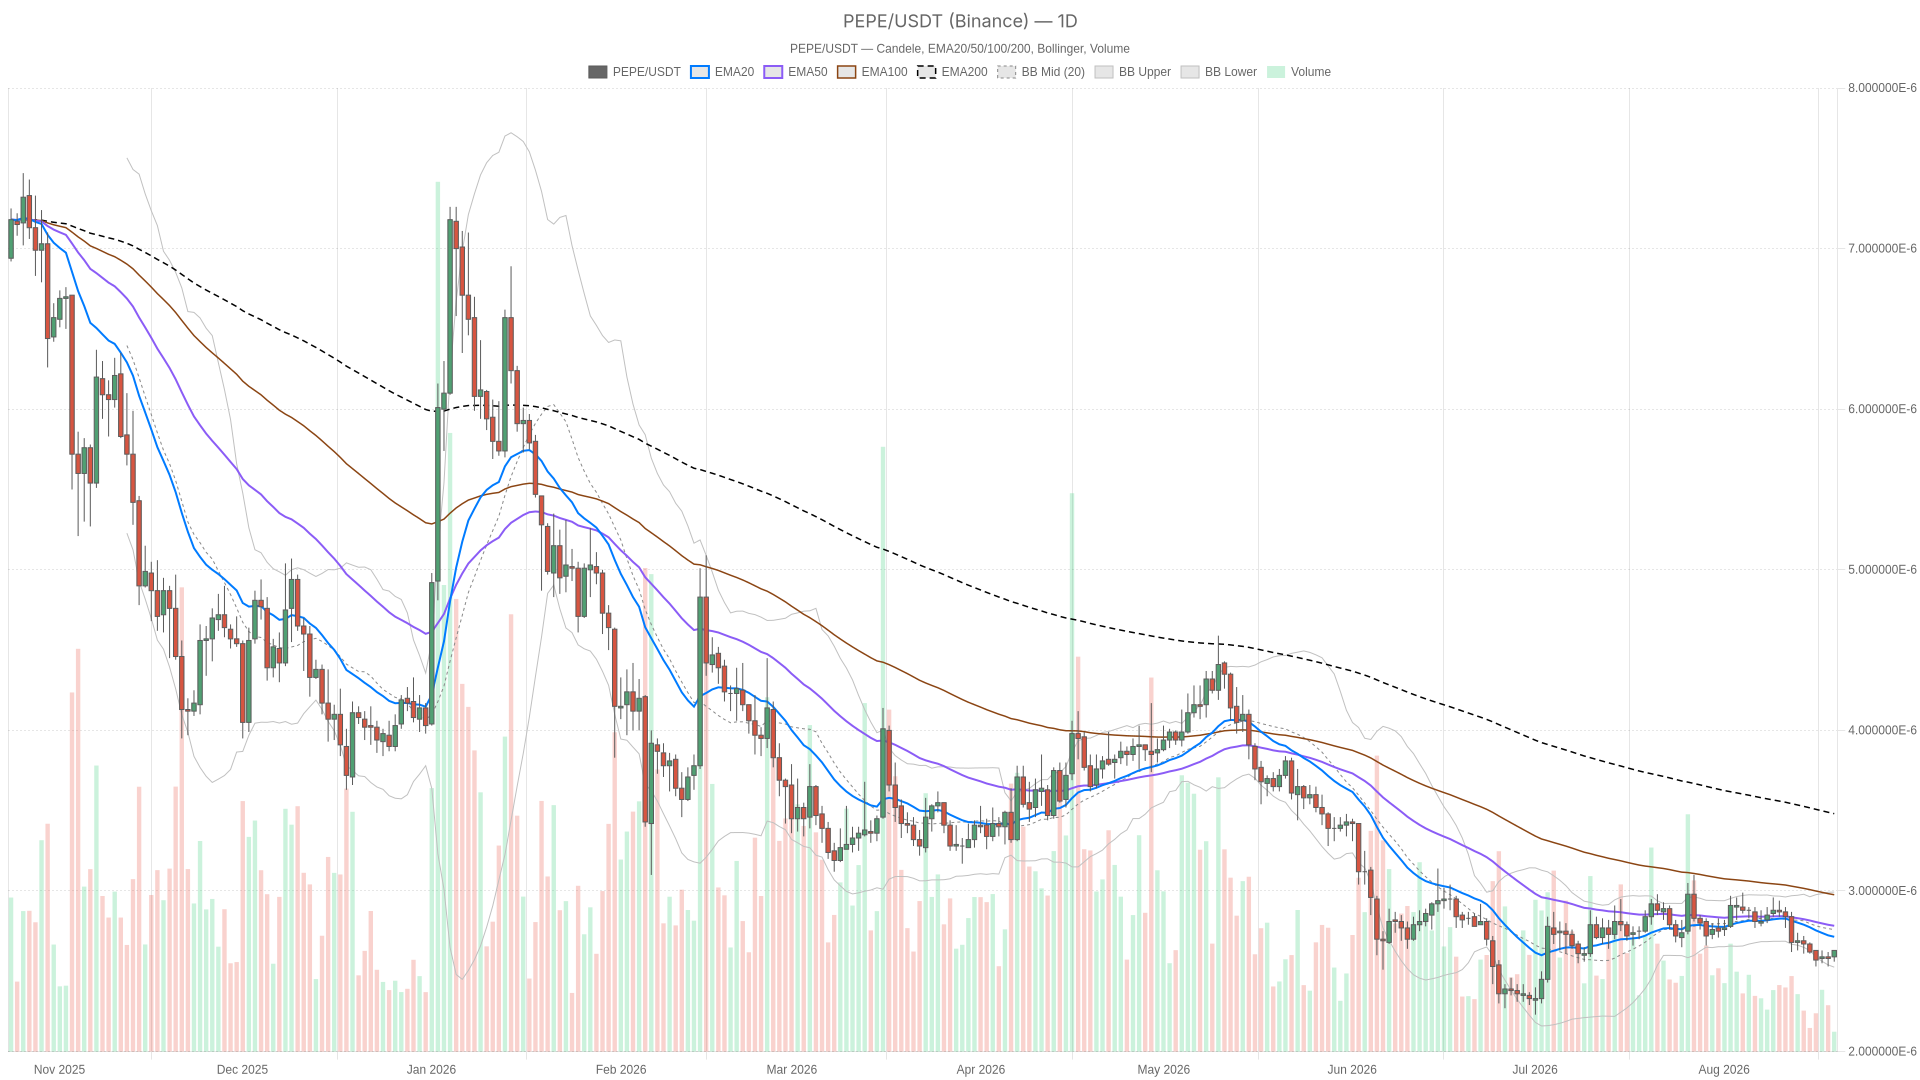
As of August 19, 2026, Pepe crypto sits between a bearish daily bias and a short-term bounce quietly turning momentum higher. The daily chart still favors sellers, while lower timeframes show buying interest. Reading each timeframe before chasing either extreme matters, since mixed signals often trap impatient traders.
Key takeaways
- Bitcoin dominance stood at 56.5% of a total crypto market cap above $2.29 trillion, according to CoinGecko.
- The Fear & Greed Index read 46, labeled ‘Fear’.
- The daily RSI(14) was 41.34, keeping the higher timeframe in a bearish regime.
- The 15-minute RSI(14) reached 62.86, the strongest reading across all three timeframes.
- The 1-hour chart showed a neutral regime with RSI(14) at 60.26.
The backdrop matters too. According to CoinGecko, Bitcoin dominance sits at 56.5% of a total crypto market cap north of $2.29 trillion. The broader market is up a modest 0.72% over 24 hours. However, that is not a risk-on stampede; capital is still gravitating toward Bitcoin rather than higher-beta meme coins. The Fear & Greed Index reads 46, classified simply as ‘Fear’. This is a market that is not panicking but also not hungry for speculative exposure.
The Daily Bias Still Leans Bearish
The daily timeframe still carries a bearish label for Pepe, meaning the higher-level trend has not shifted in favor of buyers. The RSI(14) reading of 41.34 backs that up without screaming oversold. This kind of RSI level reflects a market that has been under pressure but has not been flushed out completely; it is soft, not capitulating.
In market-logic terms, this structure still favors sellers on the higher timeframe. Any rally attempt needs to be treated as a counter-trend move until proven otherwise. The daily timeframe should anchor the overall bias, and right now it is not handing bulls the benefit of the doubt.
Momentum Is Diverging on the Lower Timeframes
On the lower timeframes, momentum is turning higher even though the daily structure has not confirmed a change. The 1-hour chart shows a neutral regime, but RSI(14) has climbed to 60.26, comfortably above the midline. On the 15-minute chart, the regime flips to bullish outright, with RSI(14) at 62.86, the strongest reading across all three timeframes. Taken together, this is classic momentum-versus-structure tension. The smaller timeframes show genuine buying interest and upward thrust, while the larger structure has not confirmed a trend change.
However, what this typically means in practice is that intraday traders have room to work with the bounce. Swing-oriented positioning should stay cautious about treating this as a confirmed reversal. The 15-minute strength can fuel short bursts of momentum. Without the daily regime flipping alongside it, these moves have historically been more prone to fading than extending.
Bullish Scenario: What Needs to Happen
For the bullish case to gain real traction, the short-term momentum would need to flip the daily regime itself, not just produce a temporary intraday pop. Buying pressure would need to persist long enough to pull the daily RSI decisively back above the midline. The regime label would also need to move away from bearish. That combination would signal genuine risk appetite returning to Pepe rather than a temporary bounce.
Moreover, a supportive shift in broader sentiment would add credibility. The Fear & Greed Index moving out of ‘Fear’ territory would help. Meme coins tend to need a genuine risk-on backdrop to sustain strength rather than isolated bursts of speculative buying.
What would invalidate this bullish read? The 1H and 15m strength would need to fade quickly. RSI on those timeframes would need to roll back below 50 without the daily confirming a change in regime. That would signal the bounce was just short covering or a liquidity-driven wick rather than a genuine trend shift.
Bearish Scenario: What Needs to Happen
The more straightforward scenario is that the current bounce exhausts itself and price rolls back into the broader bearish structure. If the 1H regime, currently neutral, tips back toward bearish and RSI there fails to hold above 50, that would suggest the short-term buying was never strong enough. It would mean the bounce could not challenge the dominant daily bias. Combined with elevated BTC dominance and sentiment anchored in fear, capital keeps rotating away from higher-risk plays like Pepe rather than into them.
What would invalidate this bearish read? A sustained daily RSI recovery alongside the regime label flipping from bearish to neutral or bullish would undercut the case for continued downside. That would be especially true if it happens in tandem with easing fear readings across the broader market.
Positioning and Risk
This is not a market handing out easy conviction trades right now. The daily structure still favors the bears, the hourly chart is sitting on the fence, and the 15-minute chart is actively bullish. Those are three different messages from three different lenses on the same asset. Therefore, that kind of disagreement usually calls for smaller position sizing and tighter risk management rather than aggressive conviction in either direction.
The Fear & Greed reading of 46 suggests the broader market has not made up its mind either. Volatility in meme-coin names like Pepe crypto tends to punish traders who oversize positions during exactly these mixed-signal stretches. The sensible approach is to let the daily regime confirm a genuine shift before treating the short-term bounce as anything more than a fragile, tradable counter-move.
In short, the daily bearish bias remains the anchor for Pepe. The lower-timeframe bounce is real but fragile, and a Fear & Greed reading of 46 keeps the broader market cautious. The bearish scenario stays the default until the daily regime confirms a genuine shift.
FAQ
Is Pepe bearish or bullish right now?
The daily timeframe carries a bearish regime, with RSI(14) at 41.34. However, the 1-hour chart is neutral at 60.26, and the 15-minute chart is bullish at 62.86. That creates a split between structure and short-term momentum.
What needs to happen for the bullish case to take over?
The daily regime would need to flip away from bearish and the daily RSI would need to move decisively back above the midline. A shift in the Fear & Greed Index out of ‘Fear’ territory would also add credibility.
How should traders manage risk in this kind of mixed setup?
Smaller position sizing and tighter risk management usually make sense when three timeframes disagree. The Fear & Greed reading of 46 suggests the broader market has not made up its mind either.
Disclaimer: This article is for informational purposes only and does not constitute financial advice, an investment recommendation, or a solicitation to buy or sell any financial instrument or cryptocurrency. The analysis provided is not indicative of future results. Investing in crypto assets and financial markets carries a high risk of capital loss. Always do your own research (DYOR) and consult a qualified financial advisor before making any decision.
Article produced with the assistance of artificial intelligence and reviewed by the editorial team.
0
0


 Manage all your crypto, NFT and DeFi from one place
Securely connect the portfolio you’re using to start.

0
0

0
0


0
0