PEPE Teeters on Edge as Price Consolidates
14d ago•

bullish:
0
bearish:
0
Share

Ready to uncover the secrets behind PEPE’s recent rollercoaster ride?
Dive into this analysis to learn what key indicators are revealing about the market’s next move and gain actionable insights to stay ahead of the game.
PEPE Daily Chart Analysis
The PEPE/USDT daily chart shows that the price has surged remarkably, moving from about 0.000009 to 0.000017 in late May. Now, it seems to be stabilizing around 0.000014.
The Ichimoku Cloud’s baseline, marked in red, is sitting around 0.000012, which could be a significant support level. If the price dips below this line, we might see a shift in market sentiment.
The two exponential moving averages (EMAs) at 0.00000871 and 0.00000623 are trending upward, suggesting that the bullish momentum could continue. As long as the price stays above these EMAs, there’s potential for further appreciation.
However, if the price falls below the Ichimoku Cloud baseline and the EMAs start to flatten or decline, it could indicate a change in market sentiment towards a bearish trend.
Read More: Pepe: A Comprehensive Guide to What It Is and How It Works
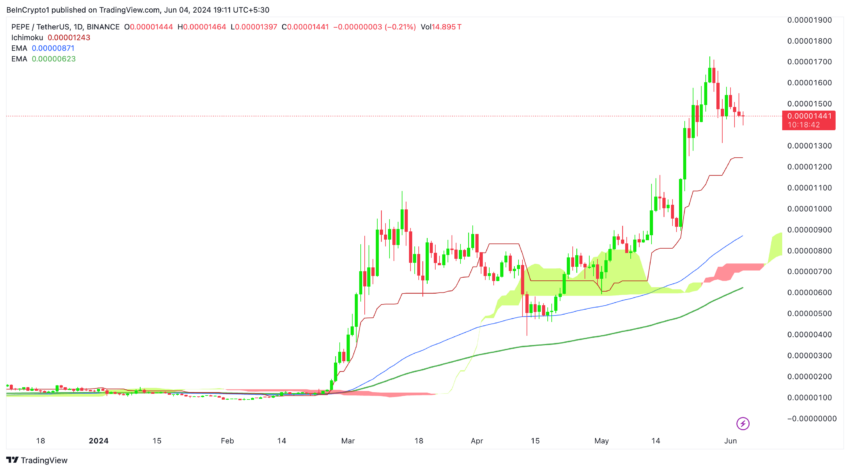 PEPE Daily Price Analysis. Source: TradingView
It’s important to watch the 0.000012 support level closely. If the price bounces off this level, it might be a good entry point for buying.
Analyzing PEPE on the 4-Hour Chart
Let’s examine PEPE/USDT on the 4-hour chart, focusing on key indicators: the Ichimoku Cloud baseline (in red), the 100-day Exponential Moving Average (EMA) in blue, and the 200-day EMA in green. We’ll also examine the current price action and what it might mean for the market.
First off, PEPE has had quite a ride recently. The price skyrocketed, then pulled back significantly. Even with this correction, it’s still trading above crucial support levels, suggesting there’s still a lot of interest and potential for further gains.
Currently, PEPE is trading inside the Ichimoku Cloud on the 4-hour chart, nestled between the baseline at 0.00001484 and the 100 EMA. This is a pivotal area. If the price can push above the baseline, it could break out of the cloud to the upside – a very bullish signal. Think of the baseline as a gateway: crossing it could ignite another rally.
Read More: Pepe (PEPE) Price Prediction 2024/2025/2030
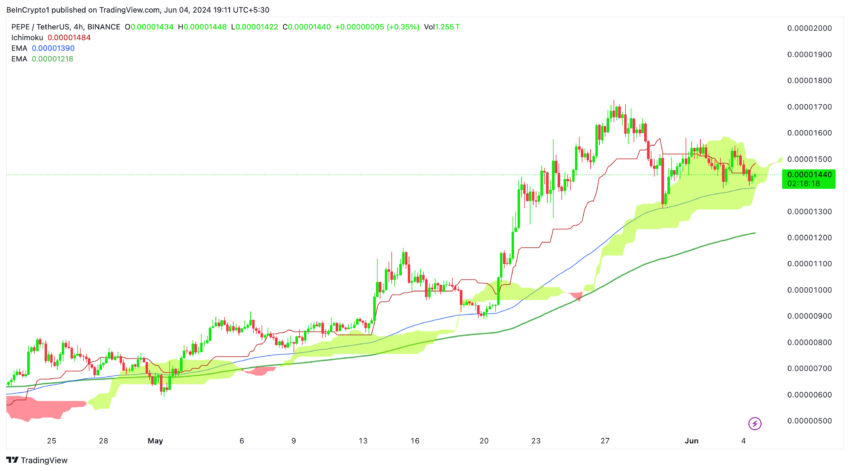 PEPE 4H Price Analysis. Source: TradingView
The price is currently wedged between the 100 EMA (0.00001390) and the 200 EMA (0.00001218). If it dips below the 100 EMA, we might see it exit the cloud to the downside, which would be a bearish signal and could reverse the current bullish trend.
The 200 EMA would become the key support level to watch in this case. Picture the 100 EMA as a guardrail; if the price falls through it, the 200 EMA serves as the safety net below.
Trading within the Ichimoku Cloud generally indicates a period of consolidation or indecision. PEPE’s current position suggests the market is at a critical juncture. Exiting the cloud from the upside would confirm a bullish continuation while dropping out from the bottom could shift sentiment to bearish.
Strategic Recommendations
For Short-term Traders: Focus on the 4-hour chart. A breakout above the Ichimoku Cloud baseline or a drop below the 100 EMA will guide your trading strategy.
For Long-term Investors, the daily chart provides a broader perspective. Monitoring the EMAs and the 0.000012 support level will help them make informed decisions.
14d ago•
bullish:
0
bearish:
0
Share


 Manage all your crypto, NFT and DeFi from one place
Securely connect the portfolio you’re using to start.

bullish:
0
bearish:
0

bullish:
0
bearish:
0


bullish:
0
bearish:
0