Will the Ethereum (ETH) Price Finally Start Playing Catch-up in 2024?
4M ago•

bullish:
0
bearish:
0
Share

The Ethereum (ETH) price was one of the most notable underperformers of 2023, increasing by only 90%.
Will 2024 be better for the altcoin, or will Ethereum continue underperforming? Let’s find out!
Ethereum Consolidates After Breakout
The ETH price has increased since falling to a low of $881 in June 2022. During the upward movement, the price failed to break out from its range high several times (red icons), except for a deviation in April 2023 (red circle).
The breakout was pivotal since the area had intermittently acted as support and resistance since 2021.
In November, the ETH price finally broke out but has not accelerated significantly despite the breakout.
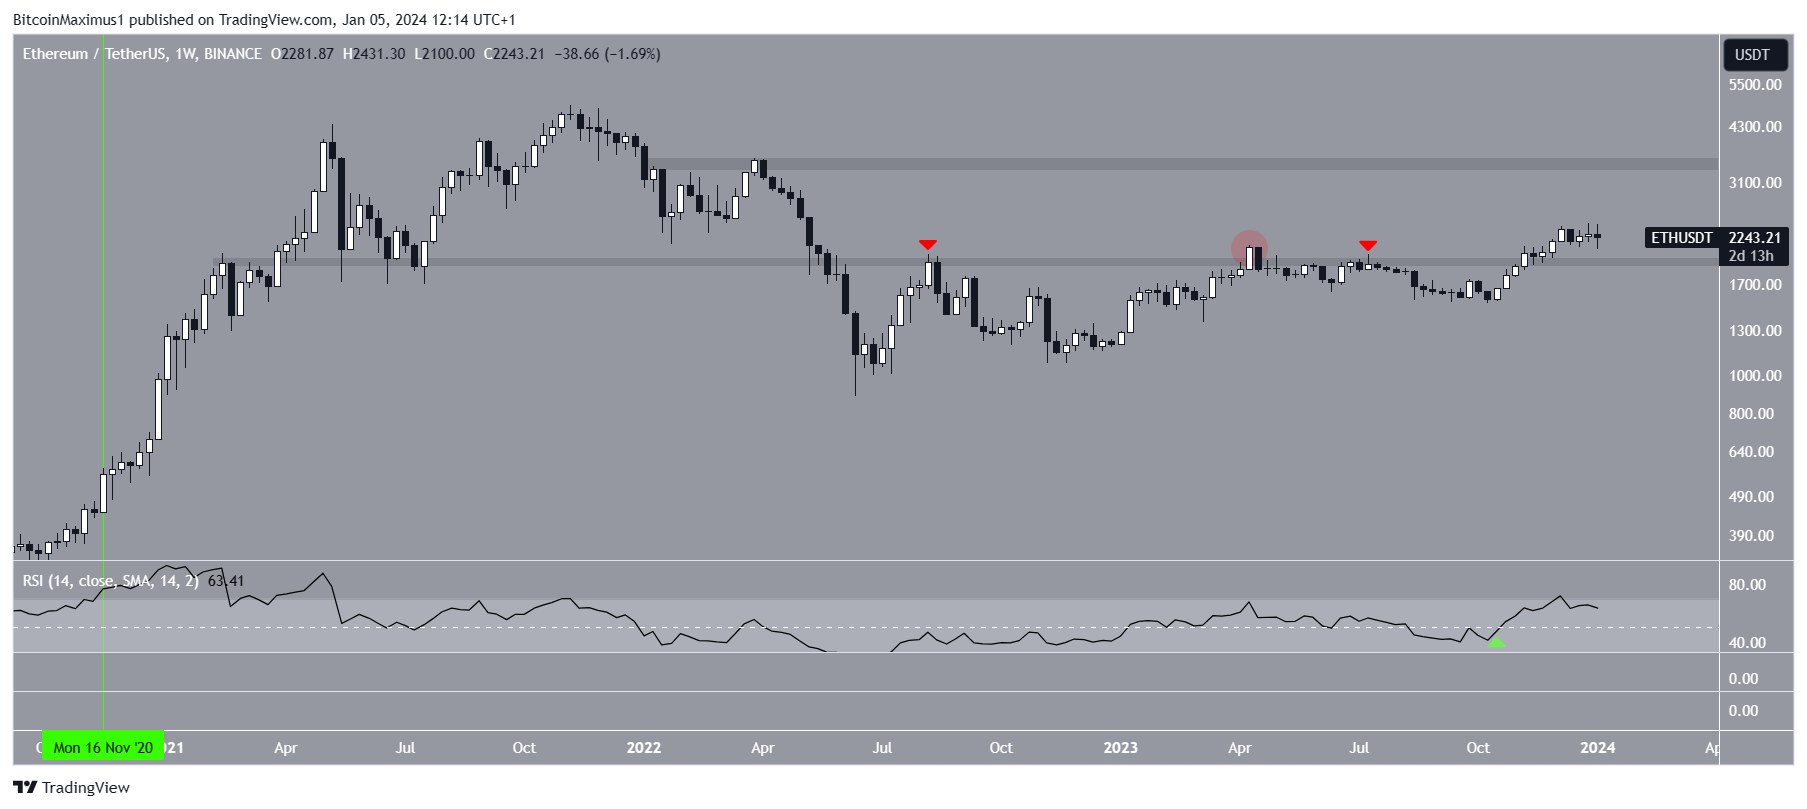 ETH/USDT Weekly Chart. Source: TradingView
The RSI is a momentum indicator traders use to evaluate whether a market is overbought or oversold and whether to accumulate or sell an asset.
Readings above 50 and an upward trend suggest that bulls still have an advantage, while readings below 50 indicate the opposite. In the previous cycle, the RSI move into overbought territory (green) was the catalyst for the acceleration of the upward movement.
Read More: What is the Ethereum Shanghai Upgrade?
What Do the Analysts Say?
Cryptocurrency traders and analysts on X have a bullish view of the future outlook despite the underperformance of Ethereum so far.
Trader Mayne believes that ETH will start playing catch-up soon. He tweeted:
$BTC to $48-$50k then distribution. After that $ETH to $3400 and ETH betas rip face. This is when you start to derisk.
CryptoMichNL suggests the ETH price will soon bottom against BTC. He also noted that Q1 has been bullish for the pair most years.
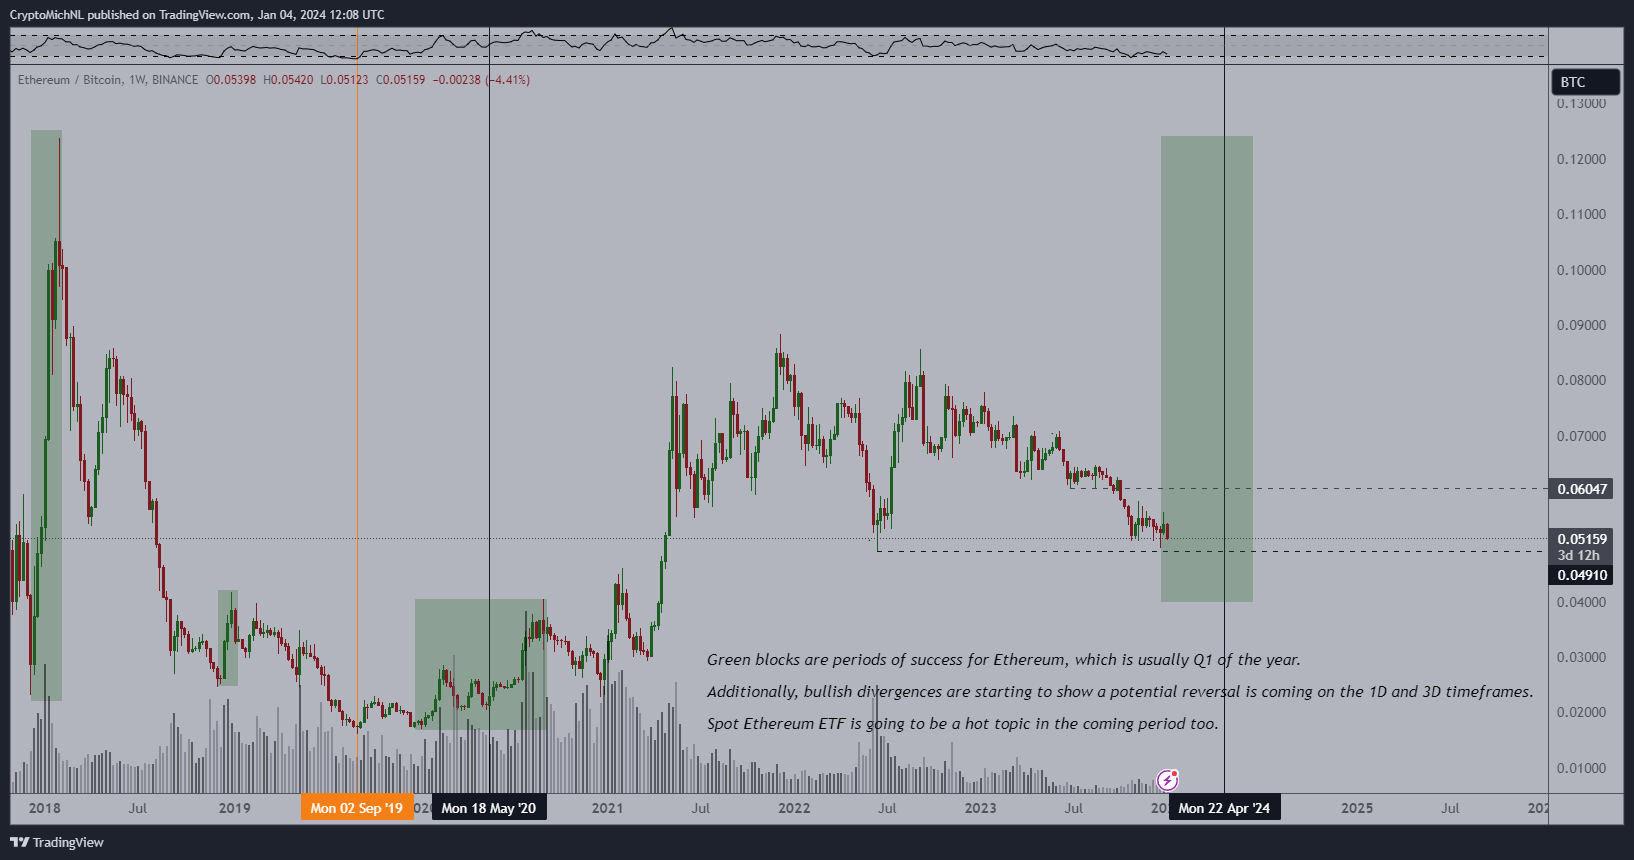 ETH/BTC Weekly Chart. Source: X
Finally, CrediBULL Crypto is bullish in the short term and suggests the price will create a higher low soon and accelerate its increase.
Read More: How to Buy Ethereum (ETH)
ETH Price Prediction: When Will Ethereum Regain Footing?
The Ethereum dominance is below a long-term support level at 17%. This is critical since it acted as resistance and support since 2021, except for a deviation in June (green circle). While the price fell slightly below the support area, it has not yet reached a weekly close below the level.
It is interesting to note that despite this decrease in dominance, Ethereum Layer-2’s total value locked reached a new all-time high today. Furthermore, the weekly RSI is in oversold territory (green icons). The previous two times it reached this level, significant upward movements followed.
The weekly RSI could also generate bullish divergence (green), a sign that preceded the entire 200% increase in 2020.
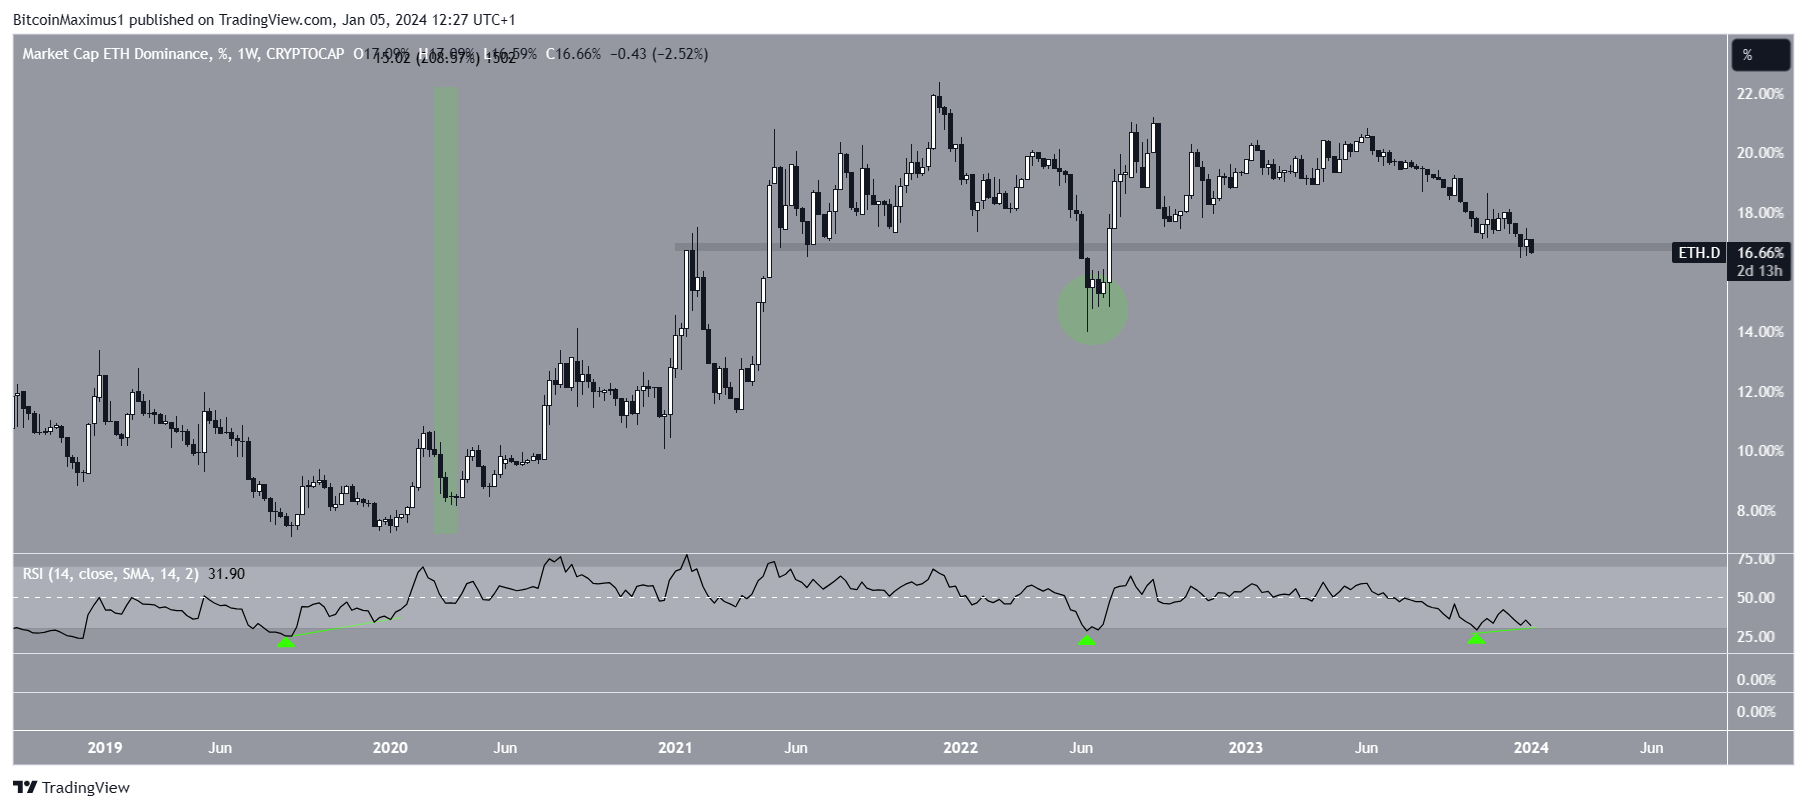 ETH.D Weekly Chart. Source: TradingView
The potential upward movement in the ETH dominance would line up positively with an ETH price increase.
As outlined before, the ETH price has broken out from the $1,950 horizontal resistance area but has yet to accelerate its increase.
Additionally, there is virtually no resistance until $3,500, 55% above the current price. This could lead to a significant appreciation of Ethereum in the first half of 2024.
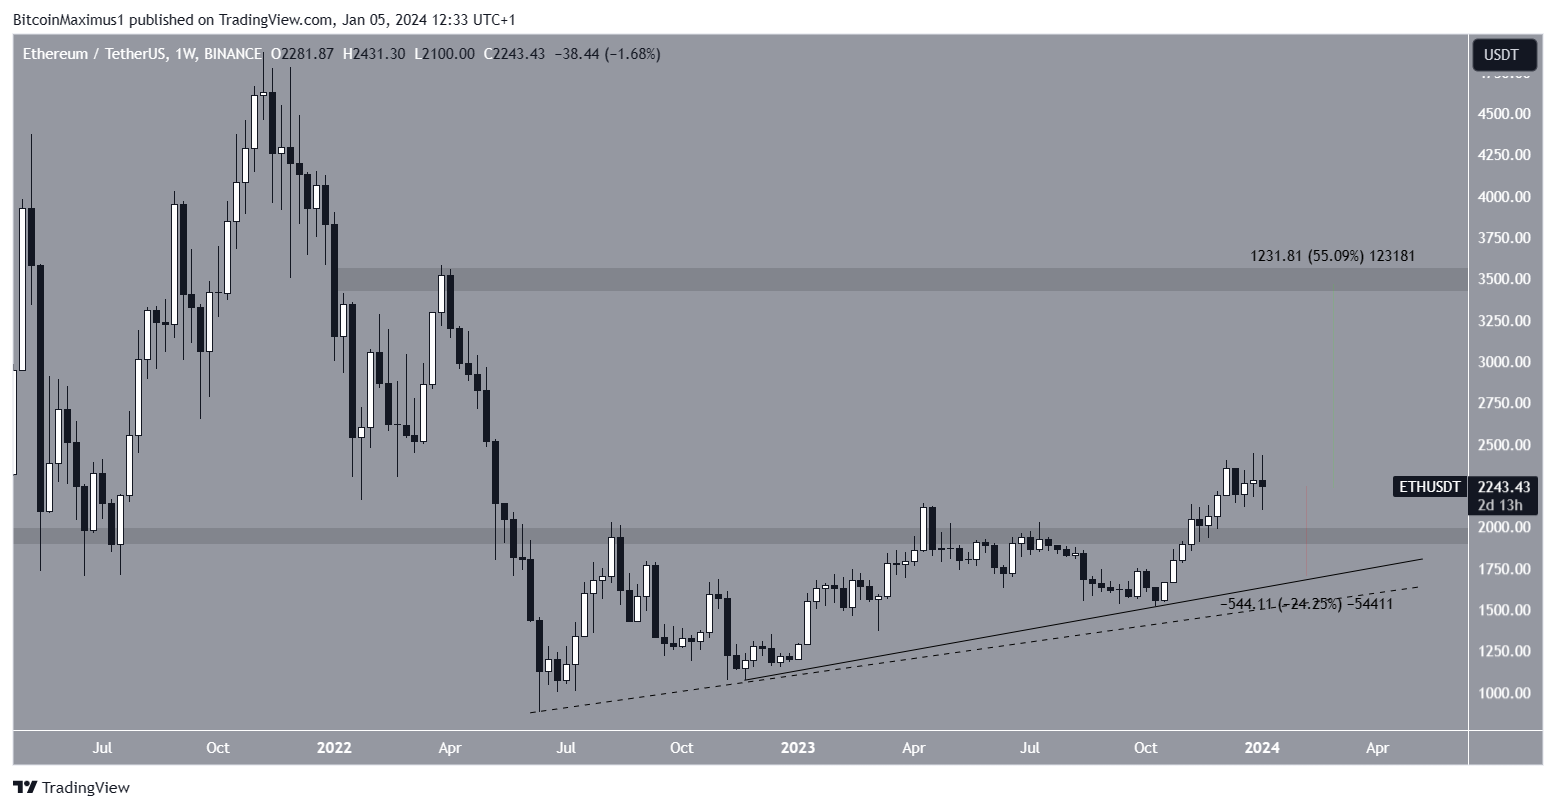 ETH/USDT Weekly Chart. Source: TradingView
Despite this bullish ETH price prediction, a weekly close below $1,950 can trigger a 25% drop to the ascending support trend line at $1,700.
For BeInCrypto’s latest crypto market analysis, click here.
4M ago•
bullish:
0
bearish:
0
Share

 Manage all your crypto, NFT and DeFi from one place
Securely connect the portfolio you’re using to start.

bullish:
0
bearish:
0


