
Will Solana Break $90 Resistance? Key 200-Day EMA Test Looms for SOL

0
0
Solana Price is trading near $85 to $86 on August 20, 2026, up about 11.50% in the last 24 hours. The token has climbed back above a cluster of short-term moving averages, and traders are watching whether it can clear the next big hurdle.
That hurdle sits at the 200-day EMA, currently near $89 to $90. A close above that line would be an important signal for anyone tracking Solana's next move.
Why Is Solana Price Rising Today?
Several things lined up at once. The U.S. Treasury doubled its long-bond buyback size to $4 billion per operation, easing worries about borrowing costs after the 30-year yield touched its highest level since 2007.
Treasury Secretary Scott Bessent led that move. The 30-year yield eased back to around 5.187% afterward, which calmed nerves across risk assets, including crypto, gold, and silver.
Total U.S. public debt also crossed $40 trillion this week. That backdrop, combined with a White House meeting between crypto executives and regulators on the CLARITY Act, gave risk assets a reason to rally together.
SEC Chairman Paul Atkins and CFTC Chairman Mike Selig were both at that meeting, alongside representatives from Nasdaq, NYSE, CME Group, and DTCC. That kind of lineup shows how closely traditional finance is now watching crypto policy.
What Do the SOL/USD Charts Show?
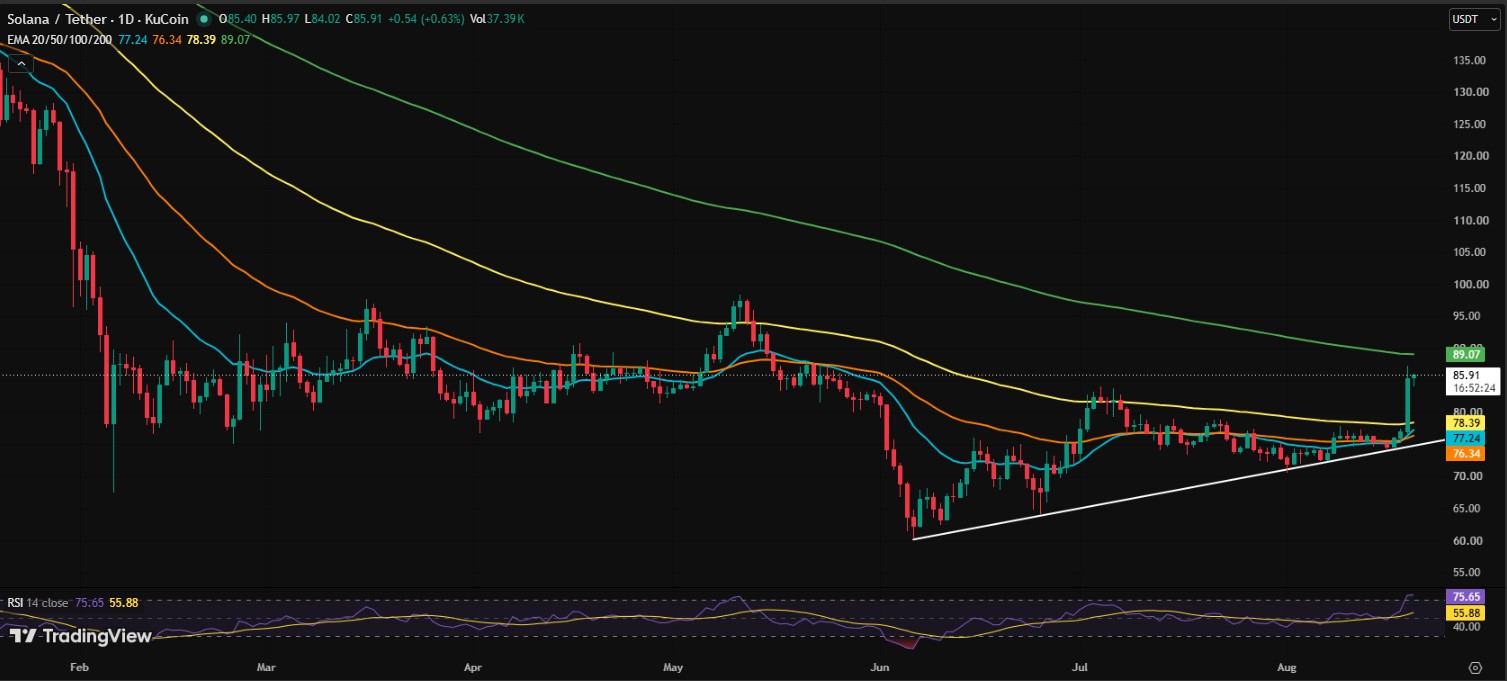
On the daily chart, Solana has been climbing along an ascending trendline from its June low near $60 to $61.
Price has also pushed above the 20, 50, and 100-day EMA cluster, which sits around $76 to $78. That is generally read as a sign of improving short-term momentum.
The 200-day EMA near $89 to $90 is the level to watch. A strong daily close above that zone could open the door toward $95 to $100, and possibly $105 to $110 if volume holds up.
If Solana fails to hold the $76 to $78 zone, though, a pullback toward the trendline around $72 to $75 becomes more likely.
Level Type | Price Zone | What It Means |
Support (EMA cluster) | 76-78 | Losing this weakens the bullish setup |
Trendline support | 72-75 | Deeper retest zone if EMA support fails |
Key resistance | 89-90 | 200-day EMA, main breakout confirmation level |
First upside target | 95-100 | Opens up if resistance clears |
Extended target | 105-110 | Possible if momentum and volume stay strong |
Are Derivatives Data Supporting the Move?
Futures data shows Solana's 24-hour volume up over 161%, with open interest rising more than 10% to around $5.73 billion.8
The long/short ratio on Binance sits near 2.04, meaning more traders are positioned long than short right now. Options open interest has also grown to close to 9.7%, near $108 million.
The OI-weighted funding rate has climbed to 0.0094% from 0.0009% a day earlier. Rising positive funding usually points to more bullish positioning building up, though it can also mean the trade gets crowded.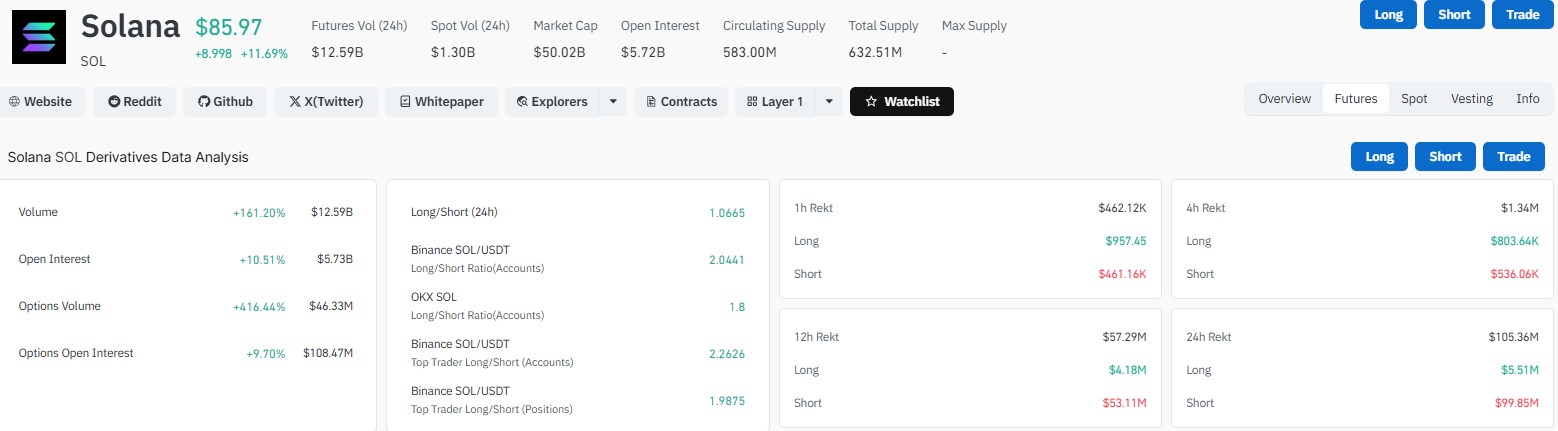
Spot Solana ETFs added $2.10 million in net inflows on August 19, according to SoSoValue. That is a modest number, but it shows demand hasn't dried up.
What Are Traders Saying About Solana's Next Move?
Crypto trader Ali Charts, who posts market commentary on X, has said $SOL looks like it is setting up for a bullish breakout, with $100 marked as the next major level worth watching.
He has also said he does not know for certain whether the bottom is already in. Rather than trying to time it exactly, he has been dollar-cost averaging into Solana, with buy orders placed between $40 and $70.
According to his post, a decisive break above $100 would make him more confident the market has already bottomed. He also pointed out that a return to Solana's January 2025 all-time high near $295 would be roughly a 288% move from current prices, while a fresh high near $400 would be closer to 430% upside. Those are long-term reference points, not short-term targets.
Alongside price watching, some holders are choosing to stake idle SOL rather than let it sit unused. Staking yields across providers generally range between roughly 5% and 7% gross, with commission rates cutting into the final payout.
On 1,000 SOL at a 5.7% gross yield, that works out to around 57 SOL a year before fees, with commission determining how much of that actually reaches the holder.
Commission is the detail that moves the final number the most. A lower cut means more of the staking reward stays with the holder, so it's one of the first things to compare across providers, alongside uptime and whether delegation stays non-custodial.
Provider | APR | Commission | Minimum Stake | Unstaking Time | Uptime |
HashKey Cloud | ~5.7% | 3% | 0.01 SOL | ~2-3 Days | 99.9% |
Figment | ~5.3% | 7% | 0.01 SOL | ~2 Epochs | 99.4% |
P2P.org | ~6.6% | 7% | 0.001 SOL | ~1-3 Days | 99.8% |
Kiln | ~6%-7% | 5%-7% | 0.01 SOL | ~2 Epochs | 99.9% |
Everstake | ~5.14% | 7% | 1 SOL | ~2-4 Days | 99.9% |
Source: Staking Rewards
HashKey Cloud is also running a promotion through August 31. Users who stake more than 1 SOL become eligible for a lucky draw, with 10 winners each receiving an additional 1 SOL. As with any staking promotion, terms can change, so it's worth checking the provider's official page before committing funds.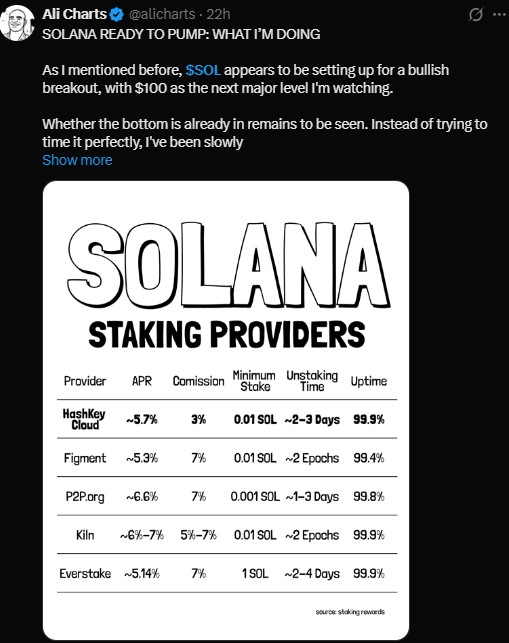
Solana Price Prediction: Will SOL Break 200 Day EMA
Solana's setup right now is neutral to cautiously bullish. Price is testing the $89 to $90 zone, and how it reacts there over the next few sessions will likely shape the short-term trend.
A confirmed close above $90 opens a path toward $100. Losing support near $76 to $78 would suggest the rally needs more time to build strength.
Macro conditions, including Treasury actions and ETF flows, are adding some tailwind, but crypto markets remain volatile and can shift quickly.
Disclaimer
This article is for informational purposes only and does not constitute financial, investment, or trading advice. Cryptocurrency markets are highly volatile, and prices can change rapidly. Always do your own research and consult a licensed financial advisor before making investment decisions. Past performance is not indicative of future results.
0
0

 Manage all your crypto, NFT and DeFi from one place
Securely connect the portfolio you’re using to start.


