
Pepe Price Prediction: PEPE Coin Set For A Powerful Move Soon

0
0

PEPE has been squeezing into a tighter and tighter range for days now, and that's really what this Pepe Price Prediction comes down to.
Pepe first showed up in 2023 as a meme token riding the well-known internet frog, and it's held its place as one of the most actively traded names in that space ever since.
Right now, the PEPE price today is $0.00000367, and is up 1.9% on the day. Market cap has climbed to $1.547B, and $233.962M has changed hands over the past 24 hours.
Pepe Coin Live Market Data
| Metric | Value |
| Price | $0.00000367 |
| Market Cap | $1.547B |
| Fully Diluted Valuation | $1.547B |
| 24-Hour Trading Vol | $233.962M |
| Circulating Supply | 420.69T |
| Total Supply | 420.69T |
| Max Supply | 420.69T |
Source: PEPE market data taken from CoinGecko, as of Sep 09, 2026. Figures may vary slightly across other tracking websites.
Liquidation Snapshot
| Timeframe | Total Liquidated | Longs | Shorts |
| 1h | $3.84K | $3.41K | $429.52 |
| 4h | $36.57K | $3.41K | $33.16K |
| 12h | $282.91K | $130.57K | $152.33K |
| 24h | $513.11K | $320.37K | $192.74K |
Source: Liquidation Data Taken From CoinGlass, As of Sept 9, 2026
Nothing too lopsided here compared to some of the recent setups, though longs do edge out shorts across most of these windows.
The 4-hour number is the one worth a second look; shorts took the bigger hit there, which lines up with $PEPE pushing back up toward the triangle's upper boundary and catching a few sellers off guard.
E
OKX isn't close to being challenged on $PEPE futures right now, sitting at $119.63M for the day. MEXC comes in well behind at $73.61M.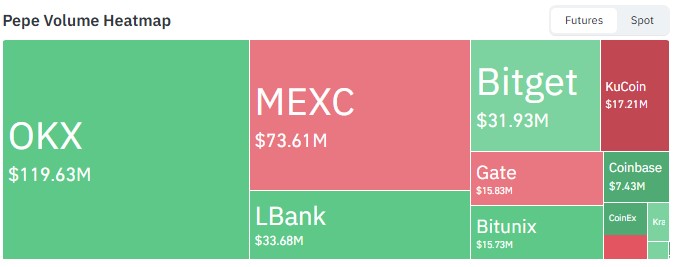
Source: Volume Heatmap Data Taken From CoinGlass, As of Sept, 2026.
Below that, LBank and Bitget are handling $33.68M and $31.93M, while KuCoin, Gate, and Bitunix each pull in somewhere between $15M and $17M. Coinbase and CoinEx close out the list with smaller contributions.
Pepe News Today: What Traders Are Watching
A Long-Term Bullish Read On PEPE
A trader going by KNIGHT called out strong upside potential for $PEPE this week, sharing a longer-term chart that maps a lower accumulation zone against a much higher target zone above the current price.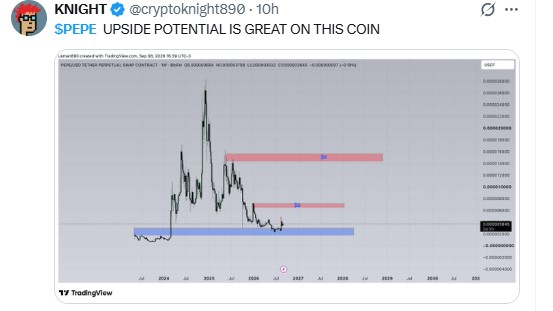
Source: Data Taken From @cryptoknight890, X Account, as of Sep 9, 2026
This is a macro, multi-month view, not a call on where $PEPE goes over the next few days, so it's best read as one trader's take on the bigger picture rather than a signal tied to the triangle setup playing out right now.
Pepe Price Prediction 2026: Technical Outlook
Pull up the 4-hour PEPE/USDT chart on Binance, and the setup is easy to spot: the price has been compressing inside a symmetrical triangle since late August, with a falling trendline pressing down from above while a rising trendline pushes up from below.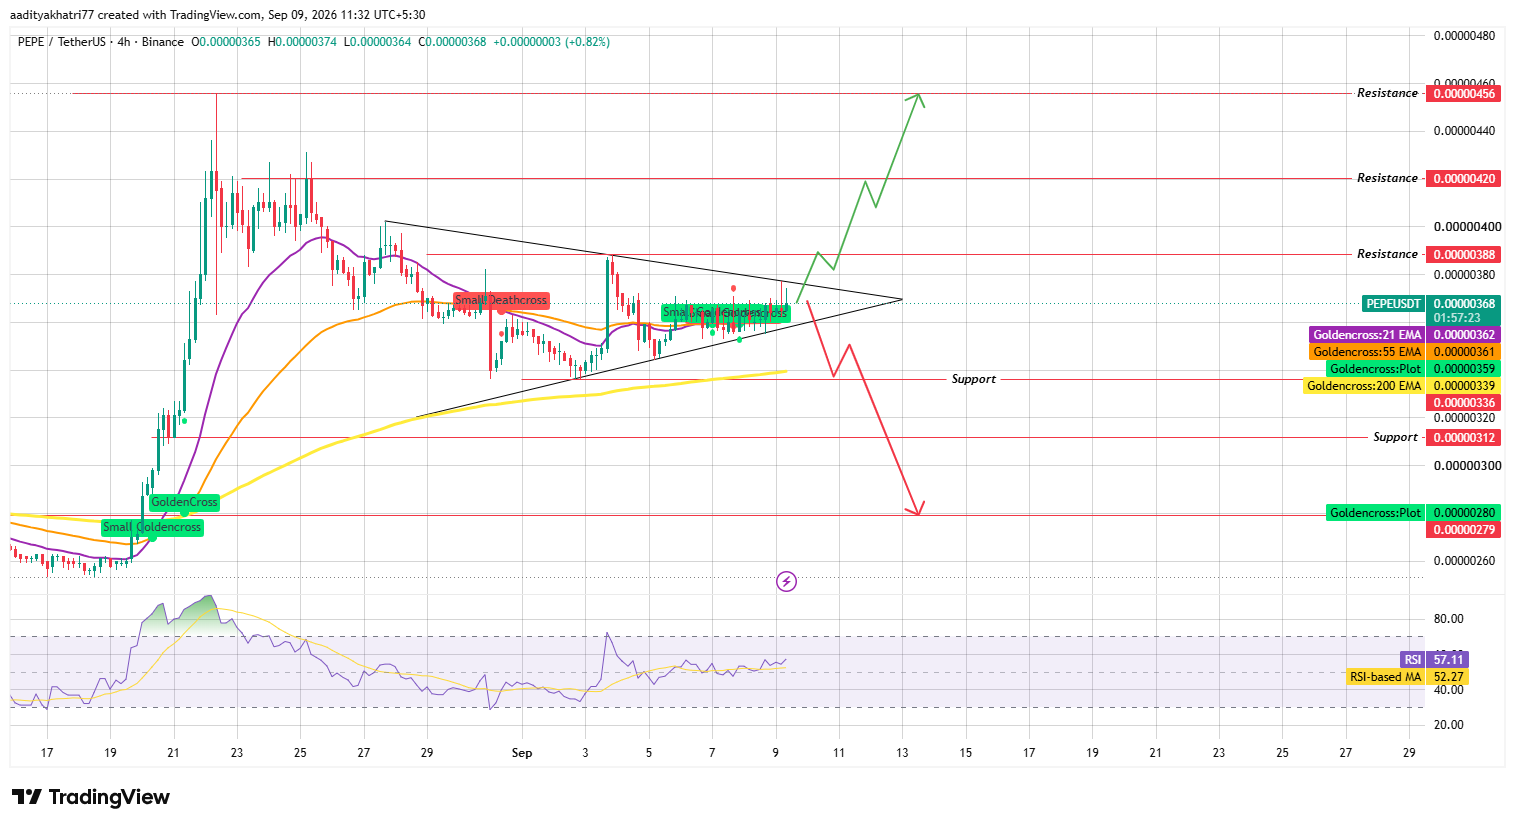
Source: Chart Taken From TradingView, as of Sep 9, 2026
That squeeze has pulled $PEPE right up near the triangle's apex, and apex points like this one rarely stay quiet for long.
A couple of small EMA crossovers have shown up along the way too, and right now the 21 and 55 EMAs are sitting almost on top of each other near $0.0000036, which about sums up how indecisive the last two weeks have been.
RSI is at 57.11, sitting above its moving average of 52.27, a small lean toward the bullish side without anything close to overheated.
Could $PEPE Break Toward Higher Resistance?
Break above the falling trendline on a strong 4-hour close with volume behind it, and $0.00000388 becomes the first stop. Clear that too, and $0.00000420 opens up, with $0.00000456 next in line if the momentum keeps carrying.
What Happens If $PEPE Breaks the Rising Trendline?
Now flip it. If the price instead breaks down through the rising trendline with volume confirming the move, $0.00000336 is the level that should catch it first. Slip past that and $0.00000312 comes into view, which would mark a real breakdown out of this multi-week squeeze.
Support and Resistance Levels
| Support | Resistance |
| $0.00000336 | $0.00000388 |
| $0.00000312 | $0.00000420 |
| $0.00000279 | $0.00000456 |
EMA Levels (4-Hour)
| EMA | Level |
| 21 EMA | $0.00000362 |
| 55 EMA | $0.00000361 |
| 200 EMA | $0.00000339 |
Bull, Base, and Bear Scenarios
| Scenario | Setup | Level |
| Bull | Break above the falling trendline on volume. | $0.00000388–$0.00000456 |
| Base | Price consolidates near the triangle apex. | $0.0000036–$0.0000038 |
| Bear | Break below the rising trendline on volume. | $0.00000336–$0.00000279 |
Glossary
Two converging lines, one sloping down, one sloping up, squeezing price tighter and tighter—that's a symmetrical triangle in a nutshell, and the eventual breakout of it usually carries more punch the longer that squeeze has gone on.
A golden cross is what happens when a shorter-term EMA climbs above a longer-term one, generally taken as a bullish sign, while a death cross flips that, a shorter EMA slipping under a longer one instead.
RSI is more about speed than direction; it clocks how fast and how far price has been moving lately, which makes it handy for spotting when momentum still has legs.
Support and resistance, at the end of the day, are just the zones where buyers or sellers have shown up often enough before to stall a move or send it the other way.
PEPE vs Bitcoin
Meme tokens have a habit of exaggerating whatever mood Bitcoin sets, and PEPE fits that pattern closely, which is why Bitcoin price today still matters so much for how this triangle plays out.
Shift the tone of bitcoin price prediction sentiment even slightly, and PEPE's thinner liquidity tends to turn that shift into a bigger, faster move than you'd see on a larger-cap coin.
Expert Opinion
Traders watching $PEPE's setup point out that a symmetrical triangle this close to its apex tends not to sit still for long; the range just gets too narrow to hold indecision for much longer.
The short squeeze visible in the 4-hour liquidation numbers gives a mild nudge toward the bullish case, though most agree the actual direction of the breakout will probably come down to broader market conditions more than anything PEPE-specific.
Disclaimer: This Pepe Price Prediction is for informational purposes only and should not be treated as financial advice. Cryptocurrency markets are highly volatile, technical patterns can fail to play out as expected, and any of the scenarios described above carry a realistic probability of not occurring. Readers should conduct independent research before making any investment decisions
0
0

 Manage all your crypto, NFT and DeFi from one place
Securely connect the portfolio you’re using to start.


