Polygon (MATIC) Price Due for a Rally as Whale Activity Climbs
21d ago•

bullish:
0
bearish:
0
Share

Polygon (MATIC) is poised for an uptrend as the number of whale addresses holding the leading Layer 2 (L2) token is beginning to increase.
An assessment of the token’s movements on a 1-day chart confirms the gradual re-emergence of bullish activity in MATIC’s market as well.
Polygon Whales Re-Ignite Interest in the L2 Token
An assessment of MATIC’s supply distribution showed an uptick in whales holding more than 100,000 tokens. In the last week alone, this investor cohort grew by 1.2%.
As of this writing, this group of MATIC investors held 77.41% of its total circulating supply of 10 billion MATIC.
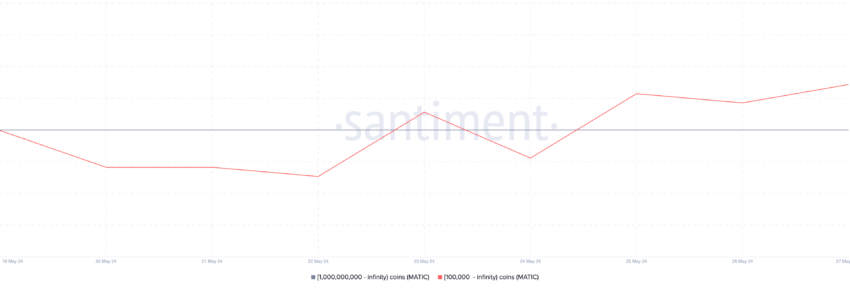 Polygon Supply Distribution. Source: Santiment
This uptick in whale activity has led to a 3% spike in MATIC’s value in the last week, bucking the general market trend of decline witnessed during the same period.
The growth in MATIC whale count during this period may be due to how profitable the transactions involving the altcoin have been. Additionally, an assessment of the daily ratio of MATIC transaction volume in profit to loss (using a seven-day moving average) was 1.03.
Read More: How To Buy Polygon (MATIC) and Everything You Need To Know
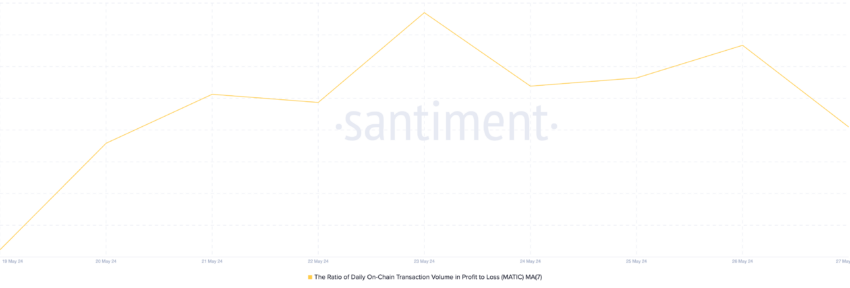 Polygon Ratio of Transaction Volume in Profit to Loss. Source: Santiment
The value of this metric indicated that in the past seven days there have been more profitable MATIC transactions than the ones that return losses. The metric suggests that for every MATIC transaction that ended in a loss, 1.03 transactions brought about profit to investors.
MATIC Price Prediction: The Bulls Are Regaining Strength
In an uptrend at press time, the value of MATIC’s Chaikin Money Flow (CMF) was 0.07. This indicator measures the buying and selling pressure behind an asset’s price movement.
When its value is positive like this, it means that more money flows into the asset on up days than on down days, suggesting that buyers are in control.
A combined reading of ADA’s positive CMF and its price uptrend signals a hike in bullish sentiment around the altcoin. Further, readings from MATIC’s Moving Average Convergence Divergence (MACD) indicator showed that its MACD line was geared to cross above the zero line at press time.
When an asset’s MACD line crosses above its zero line, it suggests a shift in momentum from bearish (downward) to bullish (upward). It indicates that the moving average is catching up to the current price, suggesting the price might be on an upward trajectory.
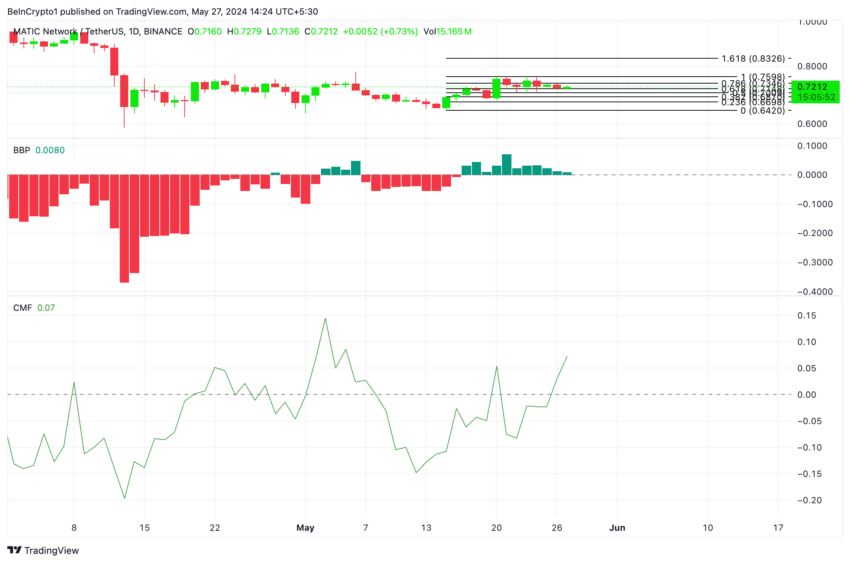 Polygon Analysis. Source: TradingView
If this trajectory is maintained and the bulls remain in market control, MATIC’s value may rise toward $0.83.
Read More: Polygon (MATIC) Price Prediction 2024/2025/2030
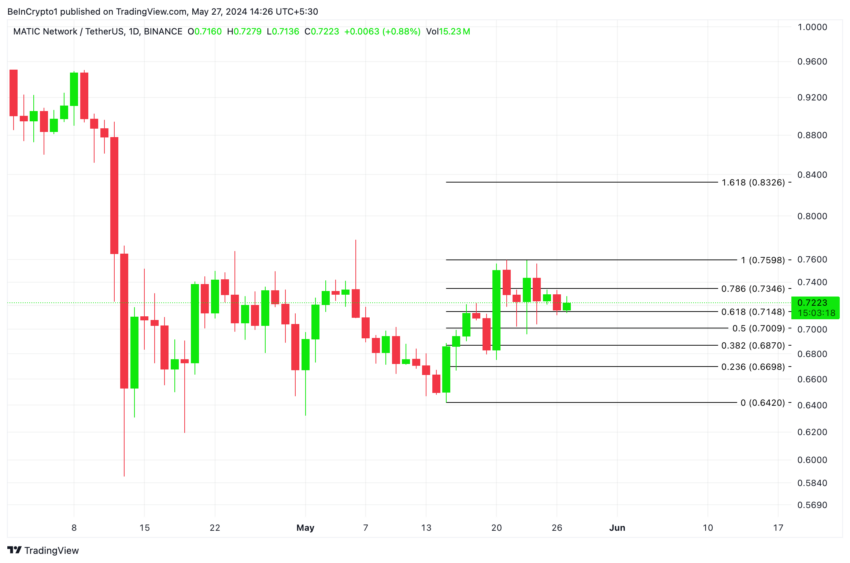 Polygon Analysis. Source: TradingView
However, any slight uptick in selling activity might invalidate this projection and cause the token’s price to drop to under $0.7.
21d ago•
bullish:
0
bearish:
0
Share


 Manage all your crypto, NFT and DeFi from one place
Securely connect the portfolio you’re using to start.

bullish:
0
bearish:
0

bullish:
0
bearish:
0


bullish:
0
bearish:
0