BONK Price Rise Sees Meme Coin Overtake FLOKI
2d ago•

bullish:
0
bearish:
0
Share
Last week, BeInCrypto’s technical and on-chain analysis predicted that Bonk (BONK) was looking to reach $0.000025. But that was not the end, as the meme coin went further and surpassed the prediction.
Amid its recent increase, something else has happened, and a deeper analysis hints at a surprising revelation.
Volatility Rises as the Solana Meme Coin Overtakes FLOKI
According to CoinGecko, Bonk’s market cap was about $1.49 billion on July 1. Around the same time, Floki (FLOKI), another meme coin, had a market cap of $1.62 billion. Fast forward to today, things changed, as BONK’s market cap hit $1.73 billion while FLOKI’s was lower at $1.70.
The rise in the market cap can be linked to BONK’s price performance since the market cap is a product of price and circulating supply. At press time, the price has increased by 10.50% in the last 24 hours.
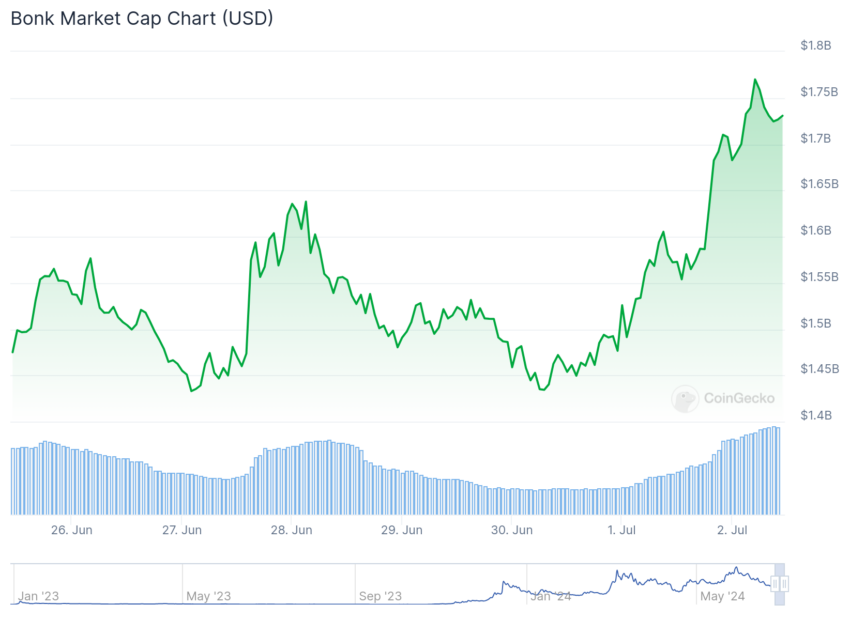 BONK Market Cap. Source: CoinGecko
This is higher than FLOKI, which is a 3.58% hike. Following the price increase, Santiment data shows that volatility around BONK has spiked. Specifically, the on-chain analytic platform put the one-day volatility at 0.042.
Volatility indicates how quickly prices can move within a short period of time. If accompanied by buying pressure, high volatility can help the value of a token surge to incredible levels.
However, if selling pressure is intense during high volatility, the price can crater in a flash. In BONK’s case, the price may continue to jump if buyers do not rest on their oars.
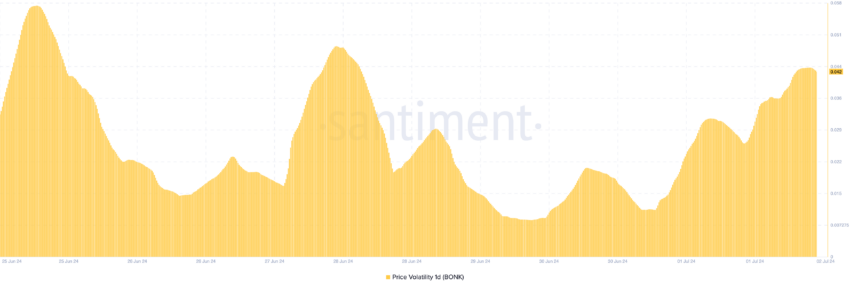 BONK 1D Volatility. Source: Santiment
BONK Price Prediction: Is the Corrective Phase Over?
Furthermore, the daily chart shows an inverse Head and Shoulder (H&S) pattern formation. Typically, a regular H&S pattern displays three successive peaks. One is in the middle (head), and the two are outside peaks (shoulders) at each end.
If this were the case, it would have marked the end of BONK’s uptrend as it is bullish-to-bearish. However, since the pattern is inverse, it means that the trend is bearish-to-bullish. Therefore, BONK’s price may reach head toward $0.000031 if buyers decide to sustain the momentum.
Likewise, the Parabolic Stop-and-Reversal (SAR) supports the potential uptrend. The SAR is a technical tool used to predict a crypto’s short-term momentum.
Read More: 11 Top Solana Meme Coins to Watch in July 2024
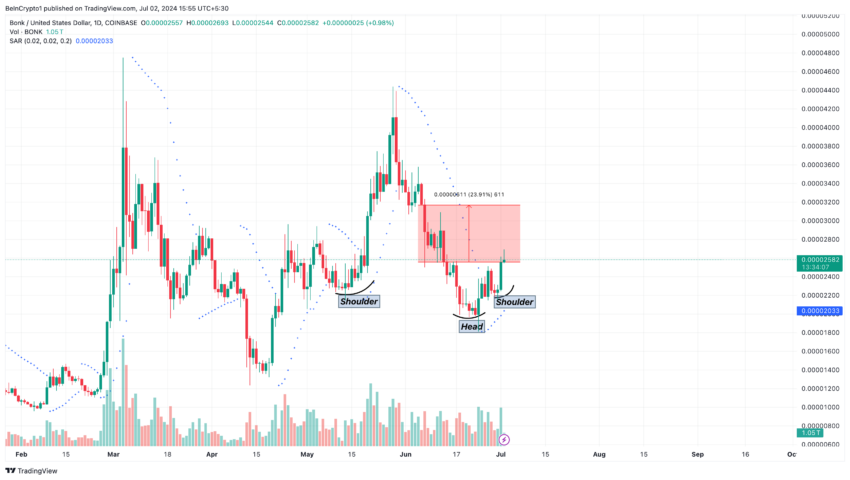 BONK Daily Analysis. Source: TradingView
When the dotted line is below the price, it means that the price can reverse downward. But for the token, the dotted lines are below it. If this stays the same over the coming days, the meme coin upswing may be validated.
In addition, the Relative Strength Index (RSI) reading increased. The RSI measures momentum using the magnitude of price changes. When it increases, it means the momentum is bullish, and a decrease implies that the momentum is getting bearish.
The RSI on BONK’s daily chart is 53.62, indicating that buyers are dominant. If this continues, BONK will hit $0.000028 and then move to $0.000031.
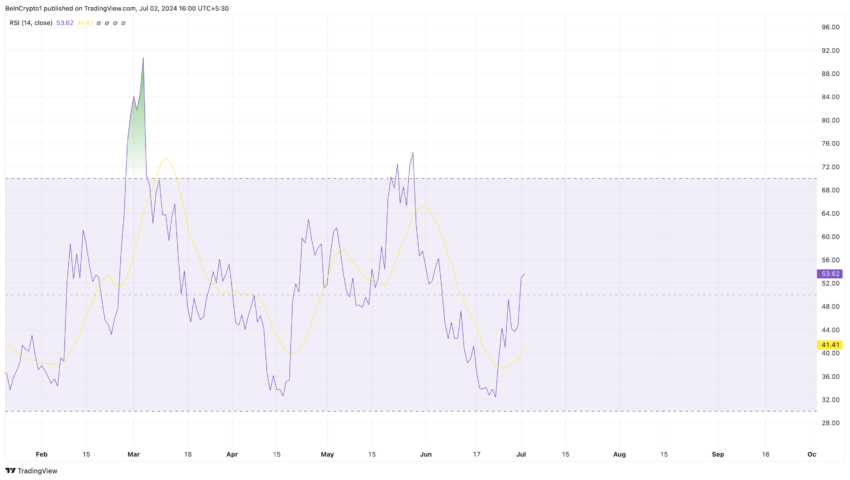 BONK Relative Strength Index. Source: TradingView
However, the token will be overbought if the RSI reading reaches 70.00 or above. Should this be the case, BONK may reverse to $0.000023.
2d ago•
bullish:
0
bearish:
0
Share


 Manage all your crypto, NFT and DeFi from one place
Securely connect the portfolio you’re using to start.

bullish:
0
bearish:
0

bullish:
0
bearish:
0

bullish:
0
bearish:
0

bullish:
0
bearish:
0