
Sui Price Prediction: $SUI Is Near a Potential Trend Reversal

0
0

Sui runs on a Layer 1 architecture built for parallel transaction processing, engineered specifically to sidestep the throughput bottlenecks that slow down older blockchain designs.
Since its 2023 launch, it's become one of the more closely watched Layer 1 tokens out there, especially among traders keeping an eye on newer-generation chain performance.
$SUI is priced at $0.691 at the moment, up just slightly over the past day.
This sui price prediction works from that starting point, leaning on the 1h and 1d chart structures below to map out what a short-term move might look like from here.
Live Market Data
| Metric | Value |
|---|---|
| Current Price | $0.691 |
| 24h Change | +0.2% |
| 24h High/Low | $0.6946 / $0.6766 |
| Market Cap | $2.816B |
| Fully Diluted Valuation | $6.91B |
| 24h Trading Volume | $140.976M |
| Circulating Supply | 4.075B SUI |
| Max Supply | 10B SUI |
Source: $SUI market cap data taken from Coingecko, data as of Aug 13, 2026. Figures may vary slightly across other tracking websites.
Liquidation Snapshot
The liquidation picture shifts depending on which window you look at.
Both the 1h and 4h windows were entirely short-side, $8.43K and $9.37K, respectively, pointing to short-term short squeezes.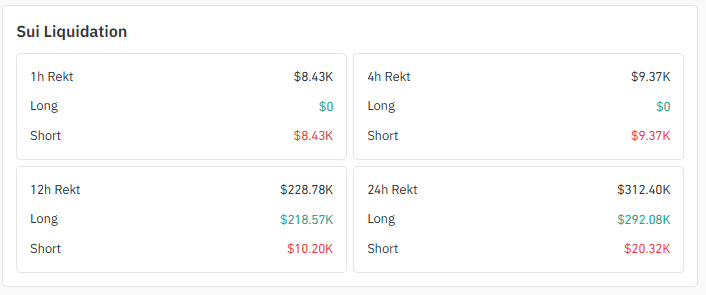
Source: Liquidation Data Taken From Coinglass .
Stretch that out to 12h and 24h, though, and the pattern flips entirely. Longs took the bigger hit here, $218.57K and $292.08K against just $10.20K–$20.32K on shorts.
Recent choppiness seems to have caught both sides off guard at different points, which tracks with the triangle compression visible on the 1h chart.
Exchange Volume
MEXC's out in front on SUI derivatives volume at $101.39M, with Binance trailing close behind at $98.40M. 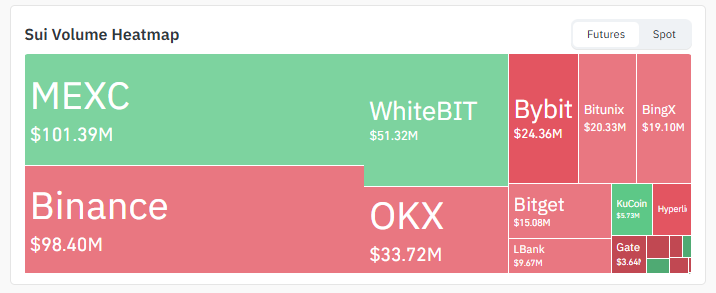
Source: Heatmap Data Taken From Coinglass.
WhiteBIT ($51.32M) and OKX ($33.72M) follow next, and Bybit, Bitunix, and BingX each add somewhere between $19M and $24M.
Nothing here is concentrated in one place. Liquidity for SUI right now looks fairly evenly spread across the major venues.
Social Sentiment of $SUI
Sui Network says its Hashi Testnet has processed more than 1.1 million deposits and 165,000 withdrawals over a three-week stretch, and over half of the related Bitcoin Signet transactions reportedly came from Hashi activity itself. 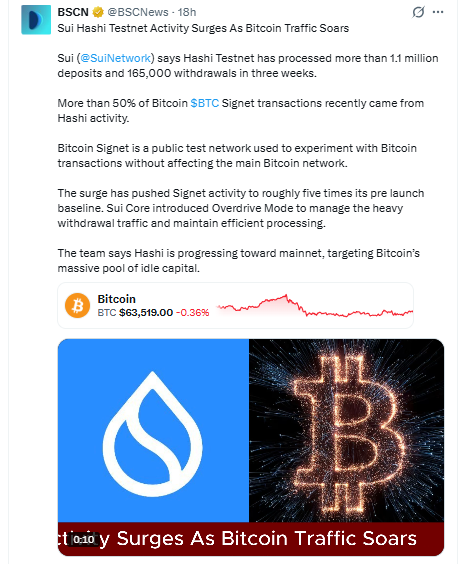
Source: Data Taken From @BSCNews , X Account.
The network also rolled out something called "Overdrive Mode" to handle the extra withdrawal traffic.
Per the network's own framing, this is being positioned as progress toward mainnet integration aimed at tapping into Bitcoin's idle capital.
None of this moves price directly, of course. Still, it's a relevant data point worth keeping in mind alongside the short-term chart setup above, especially for anyone thinking beyond just the next 48 hours.
Key Takeaways
Forecast window: short-term, next 24–48 hours, based on 1h and 1d chart structure.
-
SUI's at $0.691 right now, up 0.2% on the day. Both charts referenced here are showing price parked right at a decision point.
-
On the 1-hour chart, SUI is squeezed inside a tightening symmetrical triangle. Price is stacked close to its EMA cluster too; all four averages (20/50/100/200) are bunched between $0.6874 and $0.6889.
-
The daily chart tells a different story at a different scale: the price is sitting at the apex of a descending triangle structure, with a measured level near $0.81 if this resolves upward.
-
A confirmed move above $0.6981–$0.7071 supports a push toward $0.7732, then $0.8435. That thesis dies, though, if the price closes back below the $0.6874 EMA cluster.
-
Lose $0.6643 support instead, and the bullish case is off the table. From there, $0.6302 comes into view, with $0.5737 sitting further below as deeper daily support.
Technical Analysis
1-Hour Chart: Symmetrical Triangle Compression
The 1-hour timeframe (Binance, SUI/USDT) has price compressing inside a symmetrical triangle right now. 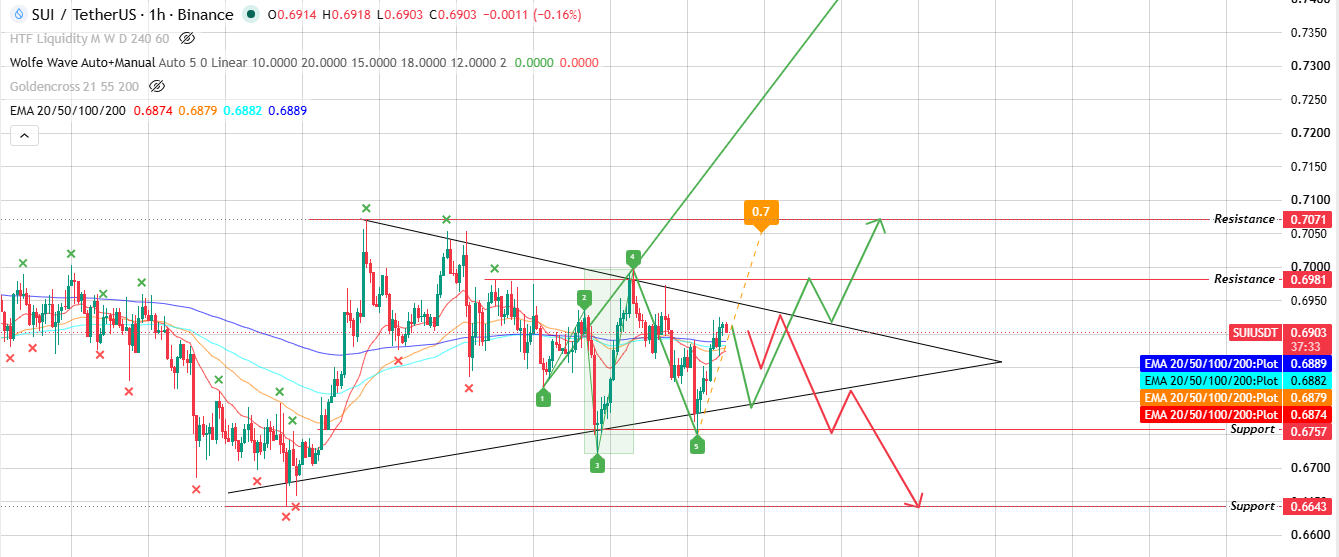
Source: Chart Taken From TradingView .
$SUI trades near $0.6903, sitting directly inside the EMA 20/50/100/200 cluster, with values of 0.6874, 0.6879, 0.6882, and 0.6889.
That's a tight grouping, and tight EMA clusters like this one typically precede a volatility expansion once one side of the structure gives.
A confirmed move above $0.6981 opens the door to $0.7071 as the next resistance level.
Go the other way, though, and $0.6757 becomes the first level, with $0.6643 waiting below that.
1-Day Chart: Apex Of A Descending Triangle Structure
Zooming out to the daily timeframe, $SUI is sitting at the apex of a descending triangle structure, one that formed after the recent high near $0.84. 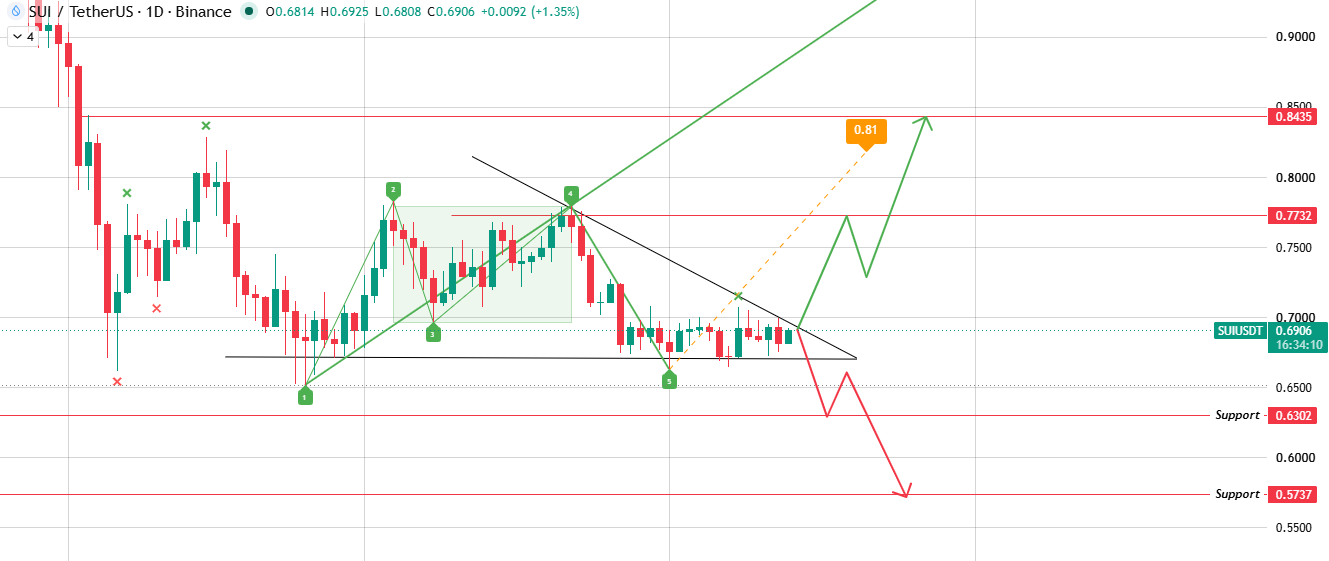
Source: Chart Taken From TradingView.
If $SUI breaks the falling trendline of the structure, then it is a clear resistance at $0.7732, and that lines up almost exactly with a measured level near $0.8435, close to the $0.81 level marked along the chart's projected path.
Fail from this apex instead, and $0.6302 becomes the next real level to watch, with $0.5737 as the major daily support if selling really extends.
Bull, Base & Bear Case
| Scenario | Outlook | Invalidation |
|---|---|---|
| Bull Case | Clearing $0.6981–$0.7071 with volume support opens a path toward $0.7732, then the $0.8435 measured levels. | The price closes back below the $0.6874 EMA cluster. |
| Base Case | SUI keeps consolidating between $0.6757 support and $0.6981 resistance while the triangle plays out. | A daily close outside either boundary. |
| Bear Case | A breakdown through $0.6643 support drags the price toward $0.6302, with $0.5737 as deeper daily support. | Price reclaims $0.6981 on a daily close. |
Glossary
A symmetrical triangle is a consolidation pattern formed by converging trendlines with roughly matching slopes, and it usually resolves in the direction of the broader trend.
EMA, short for Exponential Moving Average, weights recent price data more heavily than older data, which makes it quicker to react to short-term shifts.
A measured level is a price projection built from the height of a chart pattern, applied outward from the breakout point.
Liquidation happens when a leveraged position gets forcibly closed after losses eat through available margin.
Circulating supply is simply the number of tokens currently out there and actively trading.
Methodology
This sui price prediction draws from 1h and 1d SUI/USDT chart analysis on Binance, captured 13 Aug 2026, along with EMA 20/50/100/200 indicator readings, live market data from CoinGecko, liquidation figures from Coinglass, and current exchange volume distribution.
Every price level referenced here comes straight from the charts provided.
Nothing's been extrapolated beyond what's actually visible. Worth revisiting this forecast if SUI closes decisively outside the $0.6643–$0.7071 range.
Disclaimer: This article is for informational purposes only and should not be treated as financial or investment advice. Cryptocurrency markets are highly volatile, and price predictions carry no guarantee of accuracy. Readers should conduct independent research before making investment decisions.
0
0

 Manage all your crypto, NFT and DeFi from one place
Securely connect the portfolio you’re using to start.

0
0

0
0


0
0