Daily Market Review: BTC, ETH, XRP, SOL, NEAR
8d ago•

bullish:
0
bearish:
0
Share

Bears are still on the front foot as seen from the drop in the global market cap. The total cap stood at $2.41T as of press time, representing a 0.29% drop in the last 24 hours. The trading volume stood at $50.7B, representing a 20% pump over the same period.
Bitcoin Price Review
Bitcoin (BTC) has posted a few gains in today’s session despite the bear trend. Looking at an in-depth analysis, we see that the Bitcoin price is currently below the Ichimoku Cloud, indicating a bearish trend. The cloud ahead is red and widening, suggesting continued bearish momentum.
On the other hand, the RSI is at 43.25, suggesting that the market is in a bearish territory but not yet oversold. As of press time, Bitcoin was trading at $66,974, representing a 0.55% increase over the the last 24 hours.

Ethereum Price Review
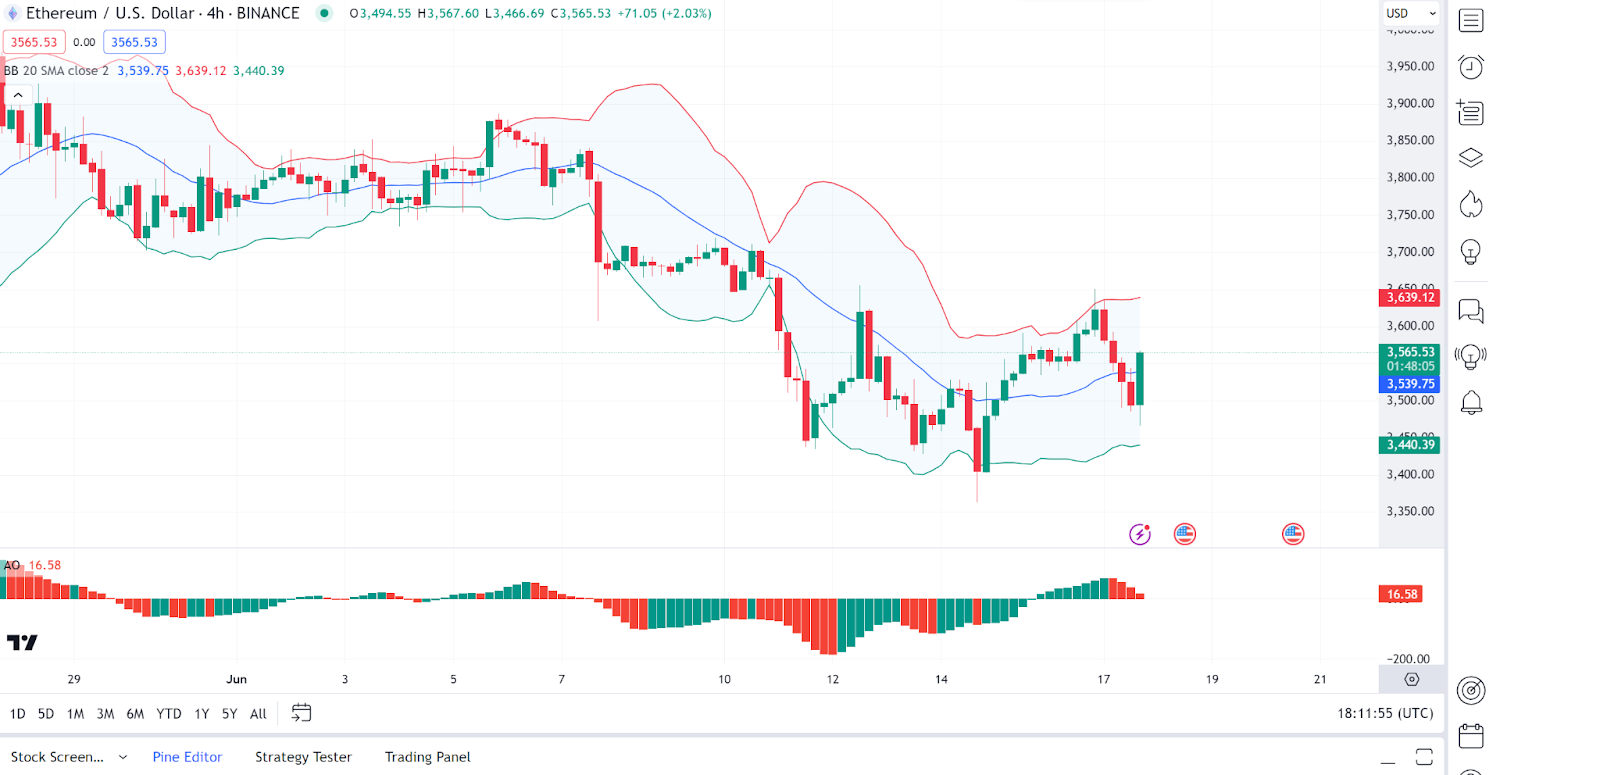
Ethereum (ETH) has howeer failed to post gains in today’s session as seen from the price movements today. Looking at an in-depth analysis, we see that the Ethereum price is currently touching the lower Bollinger Band, which could indicate the start of a short-term reversal or further bearish movement if it breaks below.
On the other hand, the AO shows red bars and is below the zero line, indicating bearish momentum. As of press time, Ethereum was trading at $3,567, representing a 0.77% decrease over the the last 24 hours.
Ripple Price Review
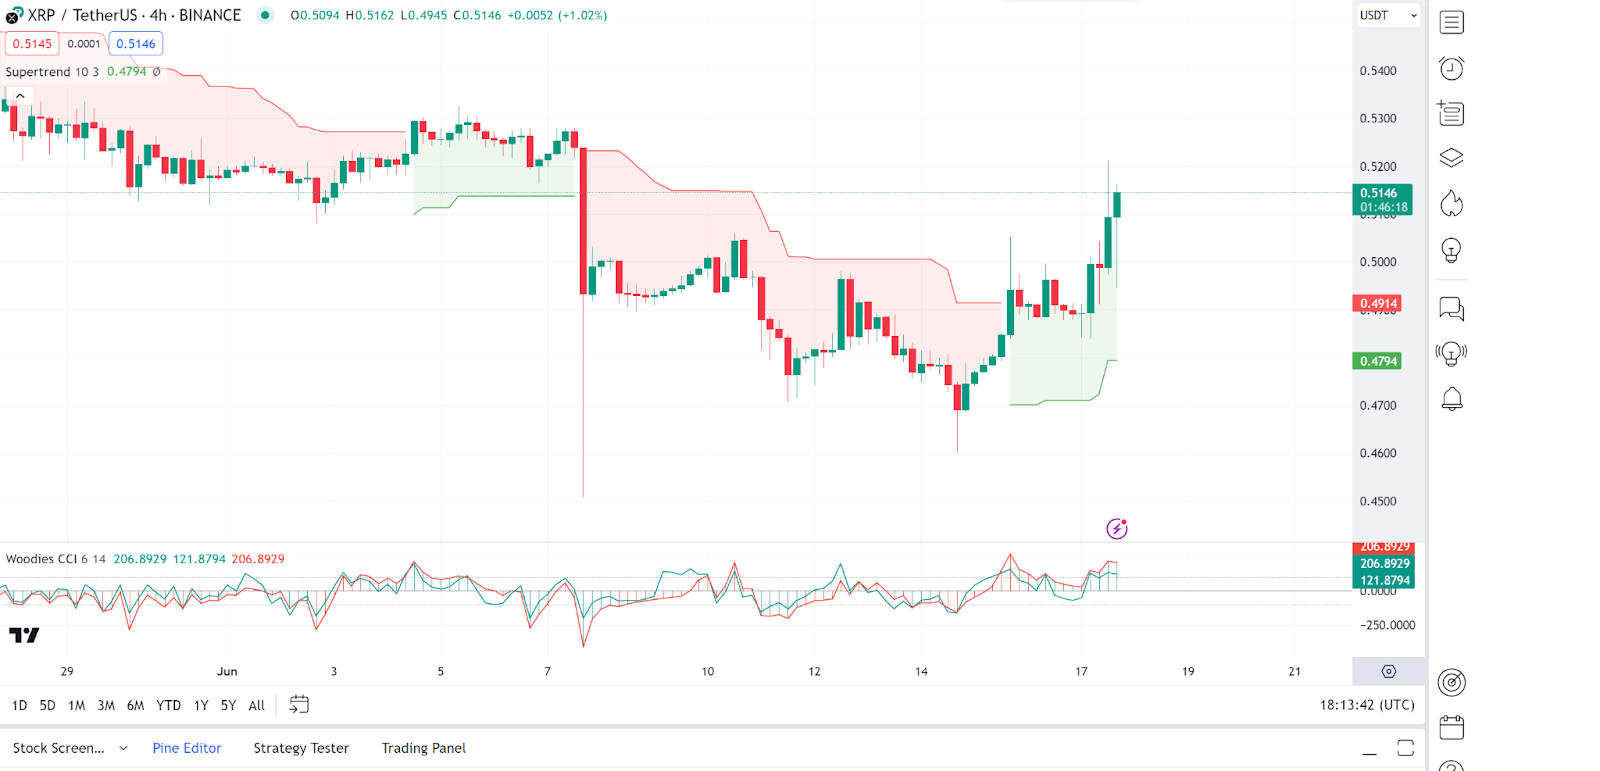
Ripple (XRP) is among the top gainers in today’s session as seen from its price movements. Looking at an in-depth analysis, we see that the Supertrend indicator is showing a buy signal as the Ripple price is above the green line (support).
On the other hand, we see that the Woodies CCI is above 100 (206.89), indicating a strong bullish signal. As of press time, Ripple was trading at $0.5143, representing a 5.2% increase over the the last 24 hours.
Solana Price Review
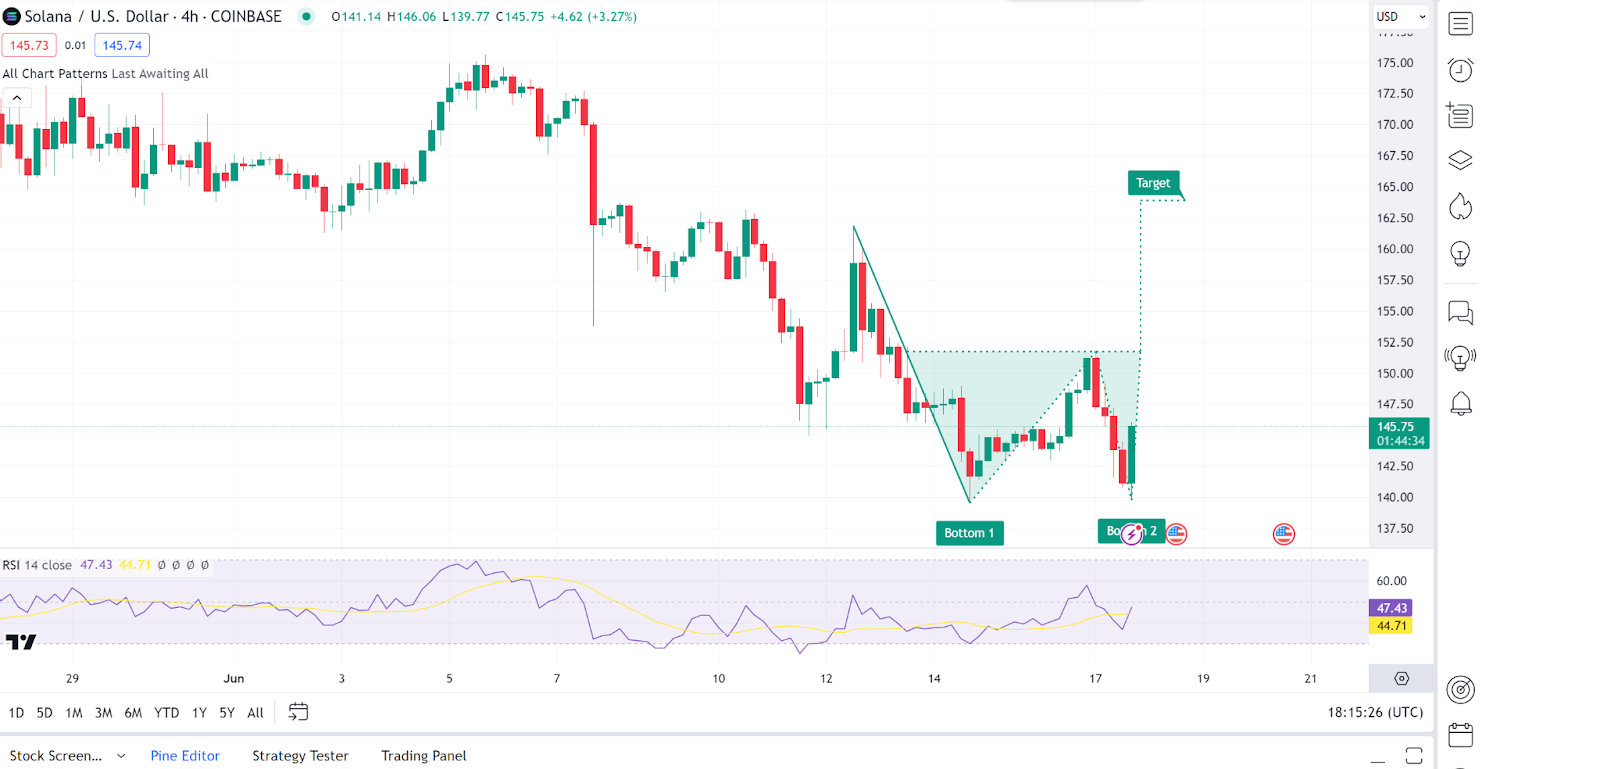
Solana (SOL) has also failed to post gains in today’s session as seen from its price movements. Looking at an in-depth analysis, we see that the pattern suggests a potential bullish reversal if the price breaks above the neckline.
On the other hand, we see that the RSI is around 47.43, indicating a neutral stance but leaning towards bullish as it is above the oversold territory. As of press time, Solana was trading at $146.28, representing a 1.2% decrease over the the last 24 hours.
Near Protocol Price Review
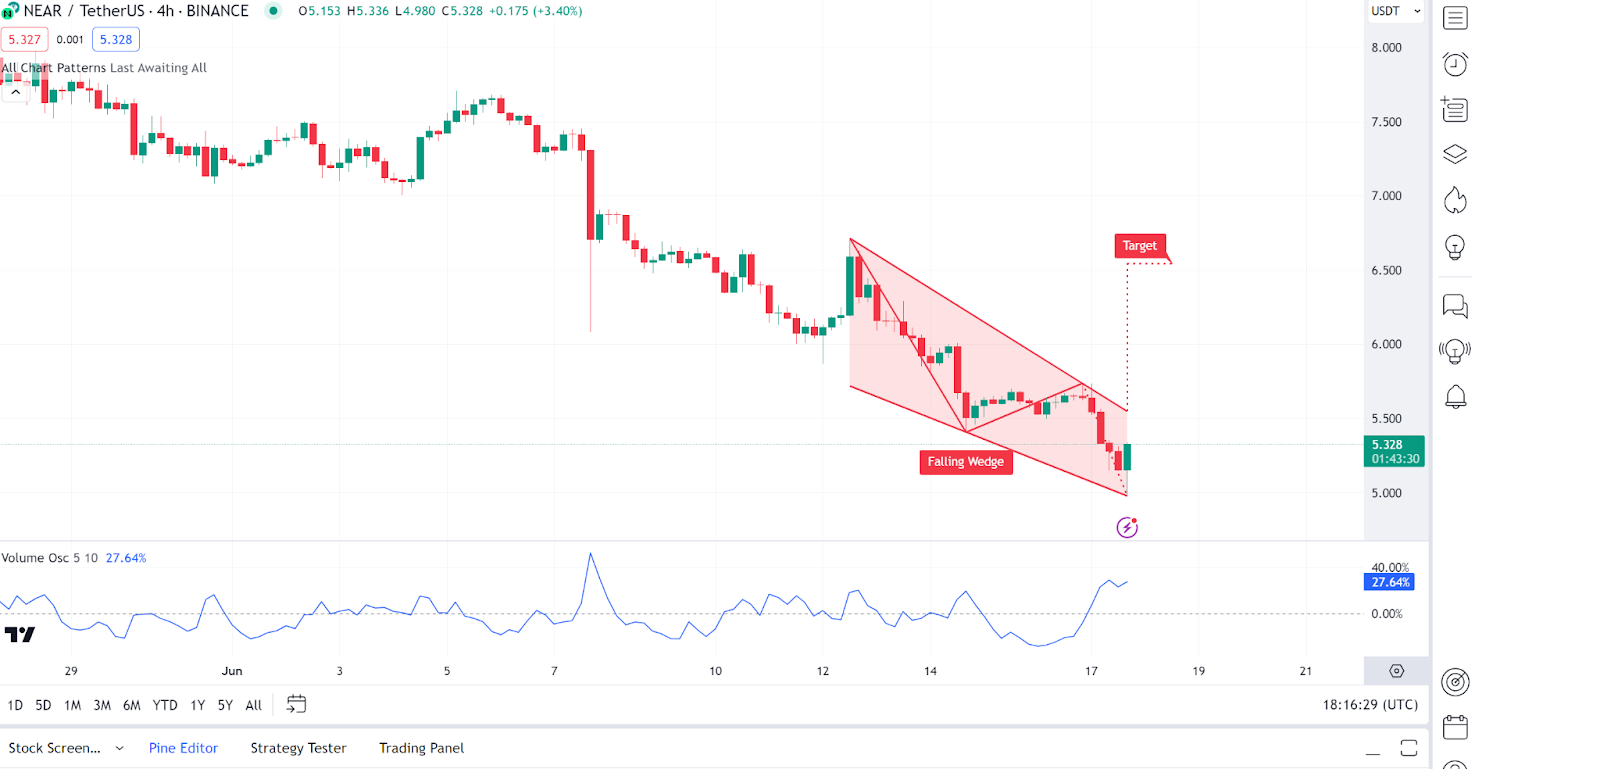
Near (NEAR) has also failed to post gains in today’s session. Looking at an in-depth analysis, we see that the Near price is at the lower boundary of the wedge, indicating a potential breakout.
On the other hand, we see that the volume oscillator is showing an increase in volume, which supports the possibility of a breakout. As of press time, Near Protocol was trading at $5.4, representing a 3.8% decrease over the the last 24 hours.
8d ago•
bullish:
0
bearish:
0
Share


 Manage all your crypto, NFT and DeFi from one place
Securely connect the portfolio you’re using to start.

bullish:
0
bearish:
0

bullish:
0
bearish:
0


bullish:
0
bearish:
0