
TRON Price Prediction 2028: Can TRX Reach $1?

0
0

TRX has spent the last couple of years grinding higher after years of going nowhere, and the monthly chart is now sitting inside a structure that traders can't really ignore anymore.
This TRON price prediction 2028 breaks down what that monthly chart is actually showing, where the real levels sit, and what it would take for TRX to either break out toward new highs or roll over from here.
$TRX Price Right Now
Metric | Value |
Current Price | $0.3315 |
Market Cap | $31.45B |
24h Volume | $303.5M |
Total Supply | 94,860,867,960 TRX |
Circulating Supply | 94,860,863,001 TRX |
TRX is up about 1.25% today, and the total supply and circulating supply are basically the same number, so there's almost no future unlock pressure hanging over this one.
That's a bit different from a lot of other large-cap coins, and it's worth keeping in mind when thinking about long-term price behavior.
TRON Stablecoin and Network Usage Outlook
TRON continues to carry one of the largest shares of stablecoin transfer volume across all blockchains, and that usage has kept growing steadily through 2026.
This isn't a narrative built on speculation; it's actual daily transaction activity, and it's one of the reasons TRX has managed to hold its structure even during broader market pullbacks.
If that usage keeps expanding, it adds real demand behind the token that isn't just tied to price speculation.
TRON Price Prediction 2028: Technical Analysis
Here's the part that matters most, and it's easier to explain by just walking through what's on the chart.
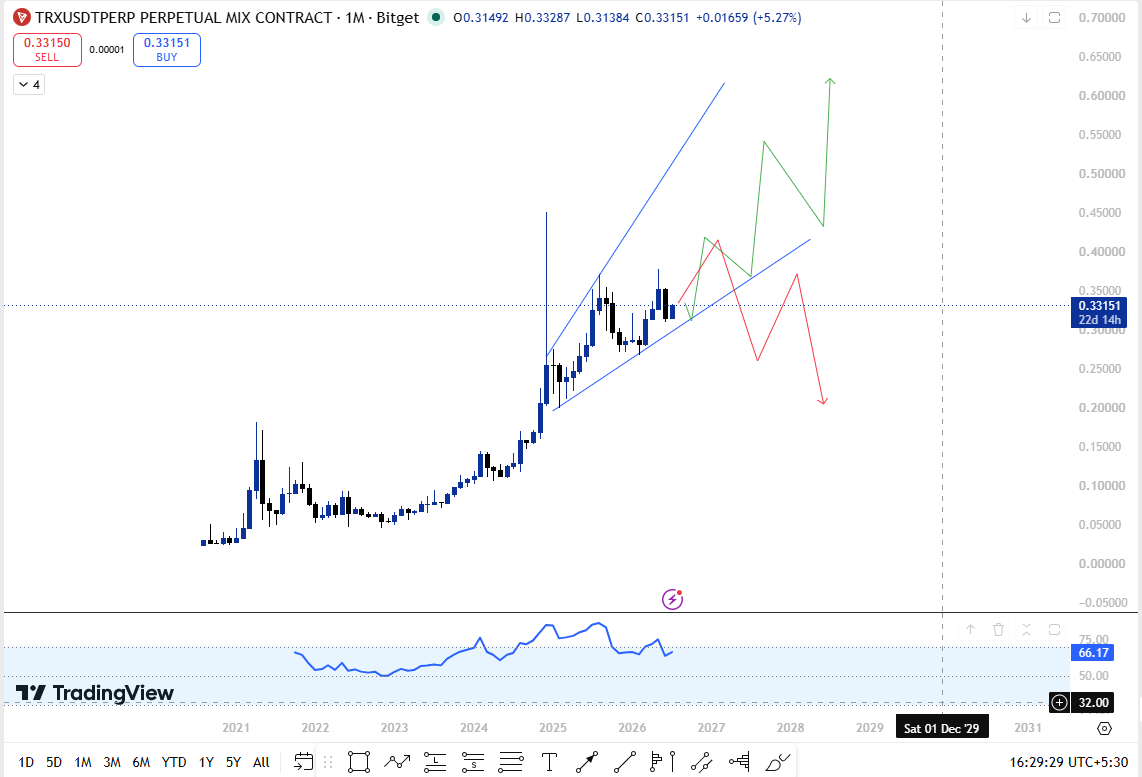
Going back to the breakout that started in late 2024, TRX has been climbing inside a rising wedge on the monthly timeframe.
You can draw two rising trendlines, one connecting the higher lows and one connecting the highs, and both lines have been converging together for a while now as price keeps grinding upward inside that shrinking range.
This is the setup that matters most right now.
A rising wedge like this can resolve in either direction, and the way it breaks is going to decide a lot about where TRX heads over the next couple of years.
If this wedge breaks down, meaning the price loses the lower rising trendline on a monthly closing basis, the chart points toward a drop back toward the $0.20 zone.
That would mean giving back a good chunk of the move built since the breakout began, and it would likely take some time to rebuild from there.
On the other hand, if TRX breaks out above the upper trendline of this wedge and holds there, the setup opens up room to run toward $0.50 first, and from there, a move toward the $1 level becomes a realistic target further out.
RSI: Momentum Still Has Room
The monthly RSI is sitting around 66, which shows strong momentum without being deep into overbought territory yet.
There's still some room left before RSI starts flashing any real warning signs, which supports the idea that this wedge hasn't fully played out either way just yet.
TRON Historical Cycle Performance
Cycle | Gain |
2017 | 5,000%+ |
2021 | 500%+ |
2024-2026 (current rally) | 350%+ |
TRX has a track record of moving hard once it clears a multi-month structure, and the current wedge is really just the latest version of that same pattern playing out.
TRON Price Prediction 2028: Target Ranges
Timeframe | Scenario | Min Target | Max Target | Key Trigger |
Q4 2026 | Wedge Resolution | $0.20 | $0.50 | A monthly close confirms breakout or breakdown |
Q1-Q2 2027 | Breakout Continuation | $0.50 | $0.70 | Holds above upper wedge trendline |
Late 2027 | Momentum Phase | $0.70 | $1.00 | Stablecoin volume keeps growing |
2028 | Cycle Extension | $1.00 | $1.20+ | Broader altcoin cycle joins in |
Risk and Reward
Factor | Bull Case | Bear Case |
Rising Wedge | Breaks higher, confirms continuation | Breaks down, drops toward $0.20 |
RSI Momentum | Keeps climbing, supports breakout | Fades, signals exhaustion |
Stablecoin Usage | Keeps growing, adds real demand | Slows down, weighs on sentiment |
Broader Crypto Market | Altcoins join in; momentum builds | Bitcoin stalls, and TRX drifts lower |
TRON Price Prediction 2028: Analyst Outlook
TRON's growth story has been quietly built on real usage rather than hype, and the stablecoin transfer volume backs that up.
What's different now is that the chart has reached a genuine decision point; a rising wedge this well-defined doesn't usually stay unresolved for much longer.
Combine that with steady network adoption and TRX's fixed supply structure, and 2028 becomes a fair window for this wedge to fully play out in either direction.
For now, the level to watch is simple: a confirmed monthly close above the wedge opens the door toward $0.50 and eventually $1, while a break below it puts the $0.20 zone back in play.
Disclaimer: This article is written for educational and informational purposes only. Nothing here is financial advice. Cryptocurrency markets are volatile and unpredictable, and technical analysis does not guarantee future price movement. Always do your own research before making any financial decisions.
0
0

 Manage all your crypto, NFT and DeFi from one place
Securely connect the portfolio you’re using to start.

0
0

0
0

0
0
