Peter Brandt Hints at Major Bitcoin Rally, Cites Gold’s Past Bull Runs
8d ago•

bullish:
0
bearish:
0
Share

Peter Brandt, a seasoned trader, has compared the present market structure of Bitcoin with the previous gold bull phases, indicating the next bull run for Bitcoin. Brandt focuses on the “Inverse Head and Shoulders” pattern on the BTC price chart, which is similar to the previous patterns that signaled bull runs in gold, including the SPDR Gold Trust (GLD).
According to his analysis, we might be witnessing the beginning of a big move that could resemble gold in the periods of major market up swings.
Bitcoin and Gold’s Historical Patterns
Brandt’s comparison centers around the fractal patterns observed in gold’s historical price movements and Bitcoin’s current trend. The GLD chart from 2008 to 2024 shows a substantial price action forming an “Inverse Head and Shoulders” pattern from 2020 to 2023.
This formation that is usually a bullish reversal could be seen at the resistance levels of $235.25 and $244.53 and the neckline at $193.58. The ADX and positive moving average crossover also indicate that the price of gold is likely to continue rising.
2/
Current $BTC chart pic.twitter.com/Ouwk8o7SpM— Peter Brandt (@PeterLBrandt) June 18, 2024
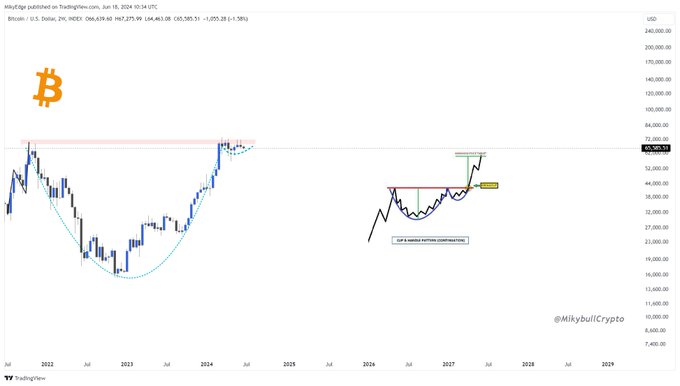
Likewise, a shorter time range on Bitcoin is marked with an “Inverse Head and Shoulders” formation. The consolidation phase is at between $55,000 and $60,000 where the 100-day EMA has offered much support.
The Relative Strength Index (RSI) is 50.71 which means the market is neither overbought nor oversold. This pattern indicates the possibility of a massive price surge if the price of Bitcoin breaks through the neckline level.
BTC Market Sentiment and Accumulation Trends
Market sentiment plays a crucial role in this analysis. BitcoinHabebe, an analyst, points out a 25% price rebound from the $57,000 to $58,000 level as a sign of buyers’ interest.
MikybullCrypto, another analyst, points out a “cup and handle” pattern on Bitcoin’s macro timeframe, which implies a breakout that may be the final bull run of the current cycle. Furthermore, Bitcoin recently touched the 128-day moving average (DMA), a crucial level that is usually witnessed in bull markets.
On-chain data also aligns with the bullish belief. Whats more, the latest price dips have seen whales transfer 20,000 BTC to accumulation addresses, the highest on record. This buy-the-dip activity shows that investors remain confident of Bitcoin’s capacity to rise even when prices have been falling and the overall market has weakened.
Current Price Action and Short-Term Predictions
The chart of Bitcoin is still critical as the currency oscillates between key support and resistance zones. Analyst Jelle points out that the market is still ranging as it has taken out local lows and highs without setting new lows. This situation shows that the market is at a crossroads, and whether it will rise to $67,000 or continue falling below $65,000 in the next few weeks depends on the outcome.
On the same note, the recent price trend indicated that Bitcoin was trading below $65,000 owing to outflows from the U.S. spot BTC ETFs partly due to the Federal Reserve’s hawkish approach. Despite this, significant accumulation and positive on-chain metrics offer a bullish outlook.
This is complimented by Michael Saylor’s MicroStrategy’s plans to raise funds to purchase more Bitcoin thus boosting the expectations of future price movements.
Meanwhile, Bitcoin’s (BTC) price has been bearish in the last day, swaying between an intra-day high and low of $67,179 and $64,422.23, respectively. As of press time, BTC was trading at $64,576, a 1.6% decline from the resistance level.
Read Also: Terra Luna Classic (LUNC) Burn Tax Change Proposal Officially Passed
The post Peter Brandt Hints at Major Bitcoin Rally, Cites Gold’s Past Bull Runs appeared first on CoinGape.
8d ago•
bullish:
0
bearish:
0
Share


 Manage all your crypto, NFT and DeFi from one place
Securely connect the portfolio you’re using to start.

bullish:
0
bearish:
0

bullish:
0
bearish:
0

