Crypto Market Price Analysis Today: Bitcoin (BTC), Super Trump (STRUMP), Ethena (ENA), Wormhole (W), EGO
28d ago•

bullish:
0
bearish:
0
Share

Bitcoin is currently experiencing a significant standoff between buyers and sellers around the $69,000 level. Daan Crypto Trades, an independent trader and analyst, mentioned in a social media post that Bitcoin has hovered near its 2021 cycle peak for approximately four weeks. It’s common for Bitcoin to experience a consolidation period of 4-8 weeks at cycle highs before its price begins to move once more.
This period of sideways trading may be frustrating for investors, yet the minimal retracement is seen as a bullish indicator. Checkmate, a pseudonymous principal on-chain analyst at Glassnode, observed in a social media post that the previous bull market cycle from 2019 to the end of 2021 saw Bitcoin undergo two major corrections exceeding 50%. In contrast, the corrections in the current bull market have been less severe, with the most recent significant drop being a 20% decline in September of the previous year.
The strong demand for spot Bitcoin exchange-traded funds (ETFs) could have played a role in mitigating losses in the current cycle. Additionally, the anticipation of Bitcoin prolonging its bull run following the Bitcoin halving event might be another factor contributing to the modest pullback.
What direction will Bitcoin take following its ongoing consolidation period — downward or upward? And have the corrections among certain altcoins come to an end? We will dive into the charts of the top 5 cryptocurrencies to discover more.
Bitcoin (BTC) Price Prediction
Bitcoin has developed a symmetrical triangle formation, signaling an equilibrium between buying and selling forces. Typically, this symmetrical triangle serves as a pattern of continuation, though it can occasionally signal a trend reversal. As of writing, *BTC* price trades at $67,738, surging over 1.2% in the last 24 hours.
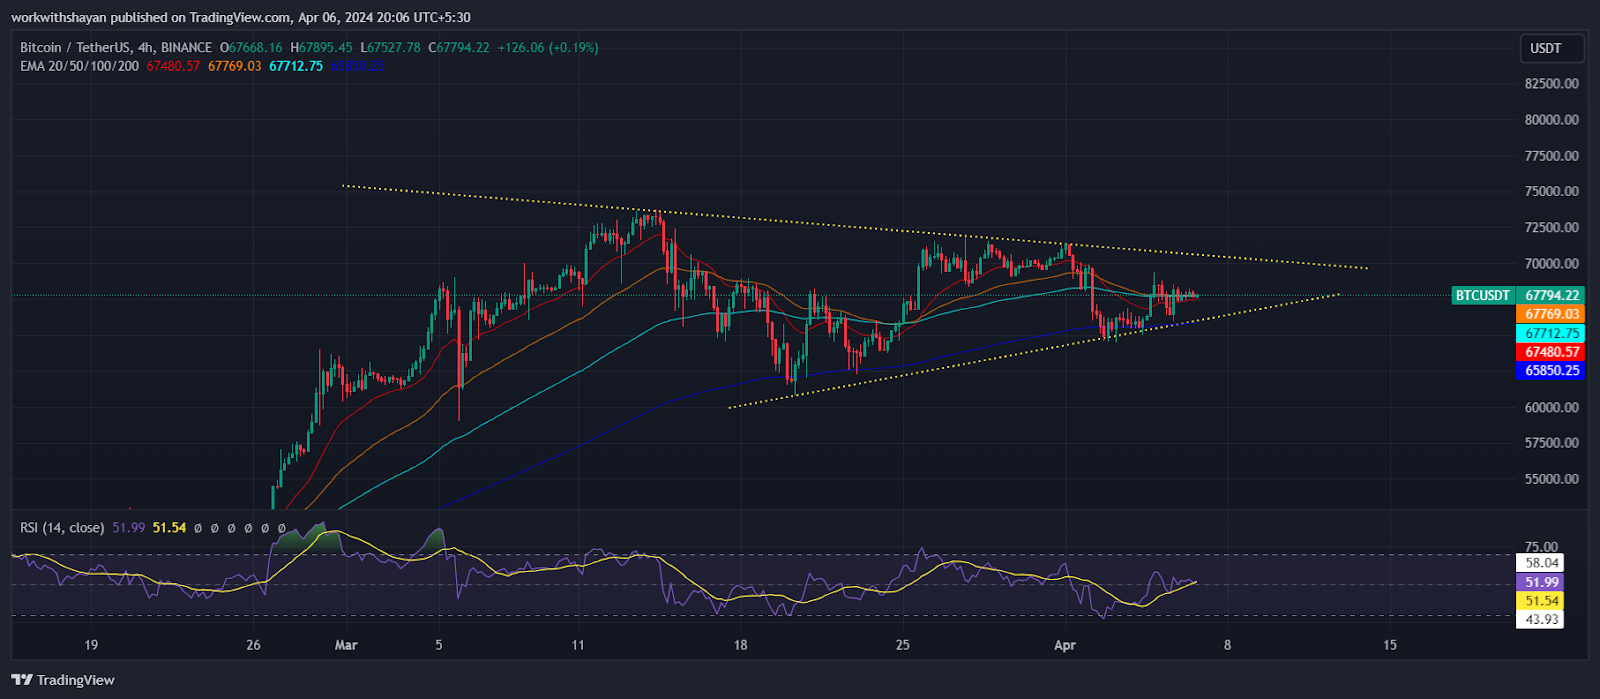
BTC/USD Chart On TradingView
The nearly flat 20-day EMA ($67,750) and the RSI positioned around the midpoint fail to provide a decisive edge to either the bulls or the bears. A downward turn and breach below the triangle could indicate the beginning of a more significant downturn. In such a case, the BTC/USDT pair might fall to $61,000 and potentially reach the 61.8% Fibonacci retracement level at $59K.
Conversely, a move upward and a break above the triangle could signal that the bulls have overcome selling pressure, enhancing the chances for a continued upward trend. Following this, the pair could climb to $73,800 and perhaps extend to $80,000.
Super Trump (STRUMP) Price Analysis
STRUMP has remained under the 50-day Simple Moving Average (SMA) after rejecting the $0.006 level. The rising bearish crossover of the moving averages, along with the Relative Strength Index (RSI) falling into the bearish territory, suggests that the sellers currently hold the upper hand. Although there is considerable support at $0.0044, a break below this threshold could lead to a further drop in the STRUMP/USDT pair to $0.003.
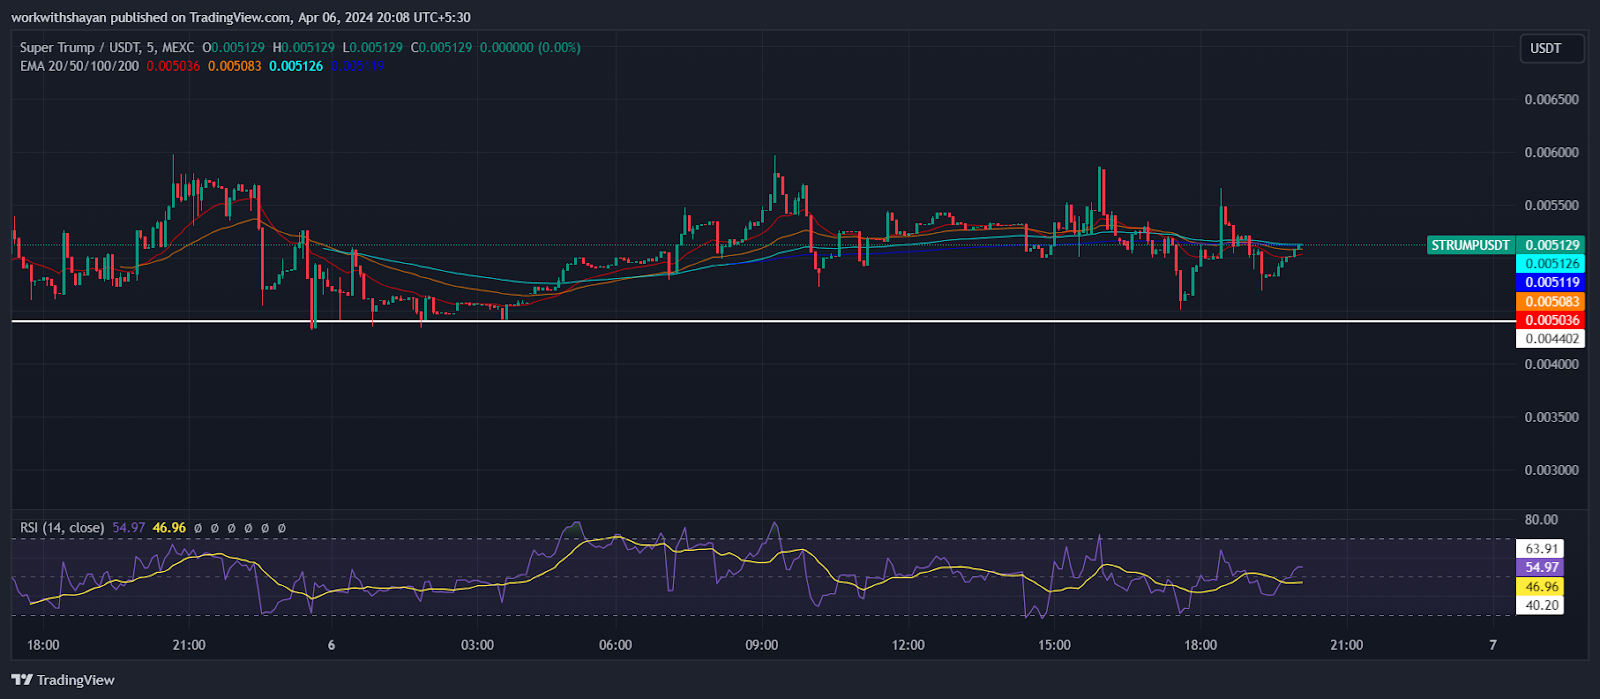
STRUMP/USDT Chart On TradingView
Conversely, a robust rebound from the $0.0044 support level would indicate a keen interest in purchasing at lower prices. This could result in the pair moving within a range between $0.005 and $0.006 for some time. Should the price climb above $0.006, it would signal a comeback in bullish momentum.
Ethena (ENA) Price Analysis
The value of Ethena has been experiencing a rapid increase, surpassing multiple Fibonacci retracement levels recently. Currently, investors are focused on continuing this upward trend by pushing the price beyond $1.23.
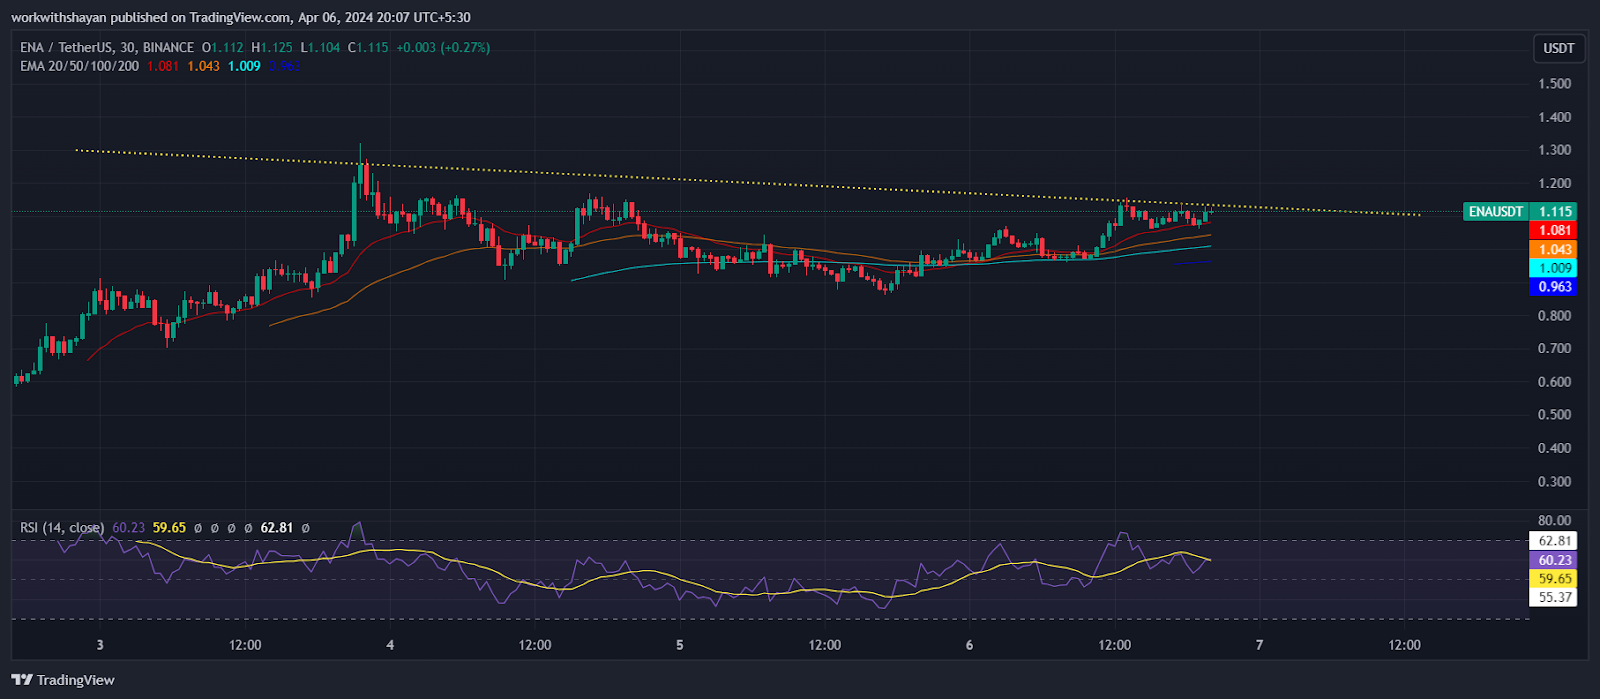
ENA/USDT Chart On TradingView
The 20-day Exponential Moving Average (EMA), now at $1.07, is showing signs of an uptick. Along with the Relative Strength Index (RSI) positioning just above the neutral 50 mark, this suggests that the buying force is strengthening. However, a decline below $1 could trigger increased selling, potentially causing the ENA/USDT pair to fall as low as $0.6.
To prevent such a downturn, it’s essential for buyers to push the price above the current moving averages. Achieving this could indicate a trading range between $1.3 and $2. If the price can break through and maintain above $2, it would be indicative of a strong bullish momentum, potentially sending the pair to a target of $2.48.
Wormhole (W) Price Analysis
The price of W has been on a downward trend, experiencing selling pressure around the $1.07 mark, which has led to a more bearish market environment. The price has been facing intense liquidation by sellers, creating a negative sentiment on the price chart.
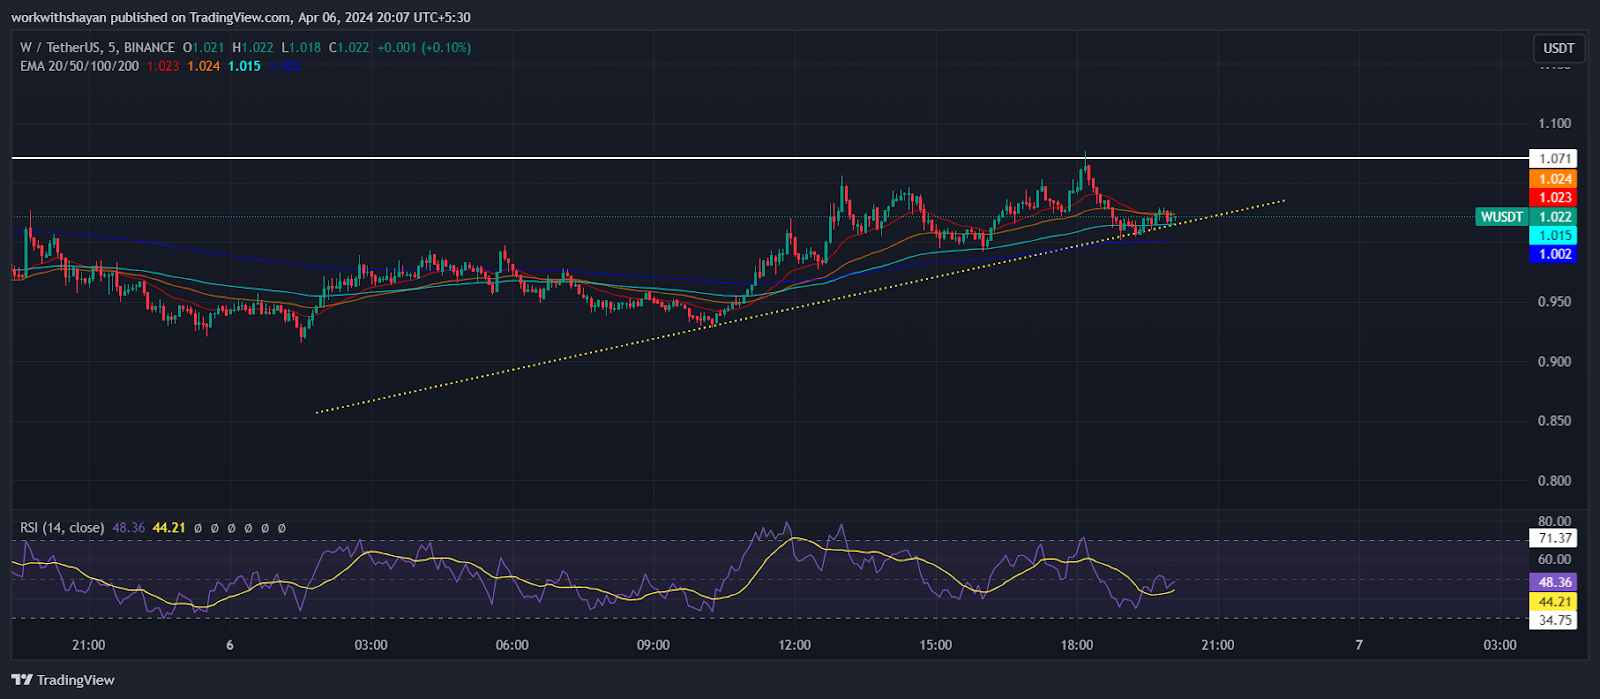
W/USDT Chart On TradingView
On the other side, buyers are not backing down and are aiming to spark a recovery from the $1 mark. This attempt at a rally could face hurdles at the 20-day exponential moving average (EMA), situated at $1.14. If the price fails to break past this point, it might raise the likelihood of falling below the $1 threshold. In such a scenario, the W/USDT pair could potentially tumble to $0.5.
Alternatively, should buyers successfully send the price above the 20-day EMA, it would suggest a strong interest in purchasing at lower levels. Such a move could propel the pair to reach $1.1 and possibly extend towards $1.4, which stands as the key resistance level to overcome.
EGO Price Analysis
EGO price has made a massive jump today, breaking above crucial resistance lines. The price surged toward the high of $0.08 but faced a rejection later, stabilizing the bullish momentum. As of writing, EGO price trades at $0.075, surging over 11% in the last 24 hours.
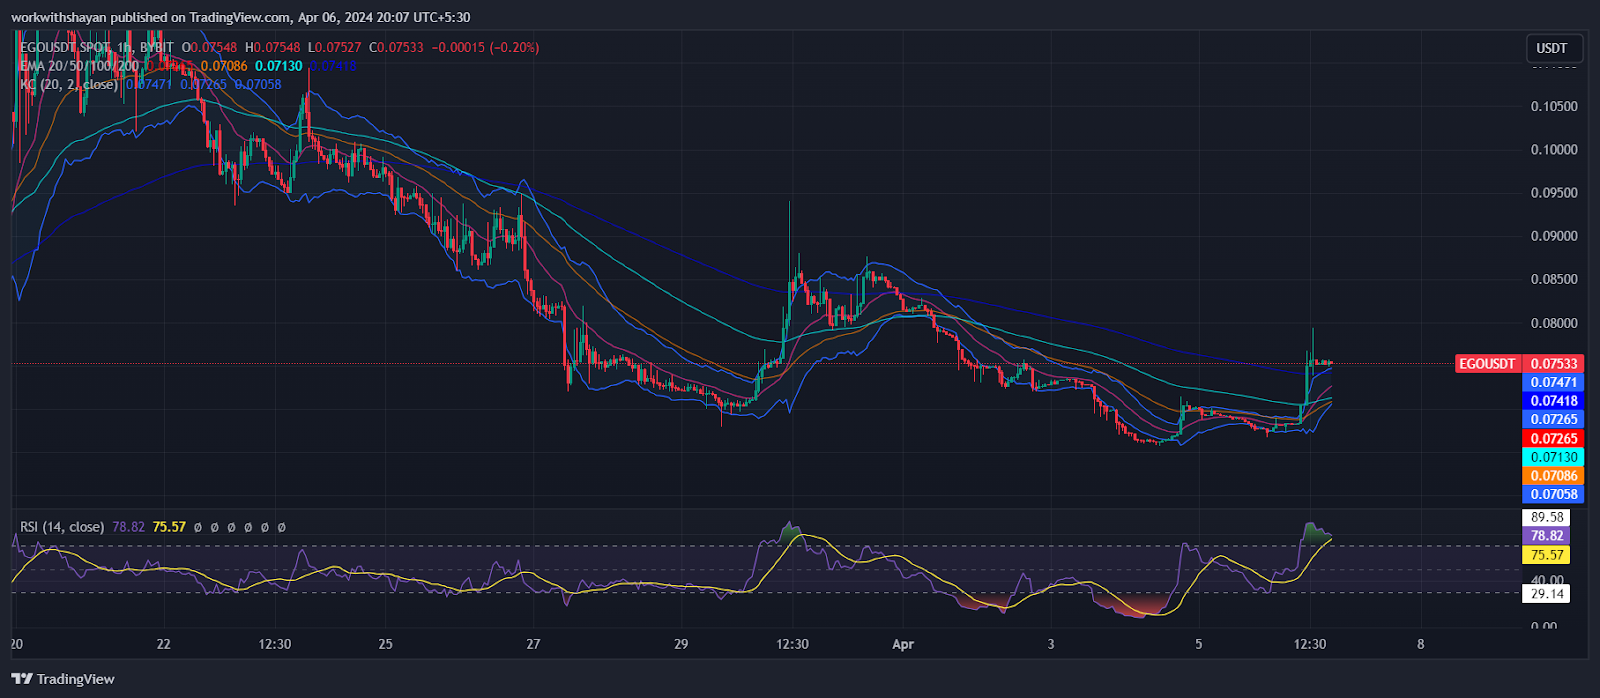
EGO/USDT Chart On TradingView
Predicting the breakout direction from a triangle formation can be challenging, so it’s advisable to wait for further momentum before taking significant positions. Should the price continue to surge from the 20-day EMA and reach beyond $0.085, it would indicate a continuation of the upward trend. Under such a scenario, the EGO/USDT pair might rise to $0.1, with a potential to reach a pattern objective of $0.12.
On the other hand, a decline below the EMA20 would suggest that bears are gaining the upper hand, potentially leading to a drop in the pair’s value to $0.066. Should this support level be breached, the subsequent target might be the pattern goal of $0.05.
28d ago•
bullish:
0
bearish:
0
Share


 Manage all your crypto, NFT and DeFi from one place
Securely connect the portfolio you’re using to start.

bullish:
0
bearish:
0

bullish:
0
bearish:
0

