ETH Price Prediction Amid Market Sell-off: Will Ethereum Crash Below $2,000?

0
0

The broader digital asset market is grappling with an aggressive correction, leaving major cryptocurrencies vulnerable to deeper losses. The macroeconomic environment has taken a severe hit as multi-theater geopolitical instabilities threaten global trade and energy markets, triggering systemic risk-off behavior among institutional investors.
When the macro financial landscape suffers simultaneous systemic shocks, high-beta altcoin leaders inevitably bear the brunt of the volatility. Ethereum (ETH) is currently caught in this macro crossfire, experiencing a sharp downward trend that puts its multi-month market structure at serious risk.
Will Ethereum Crash Below $2,000?
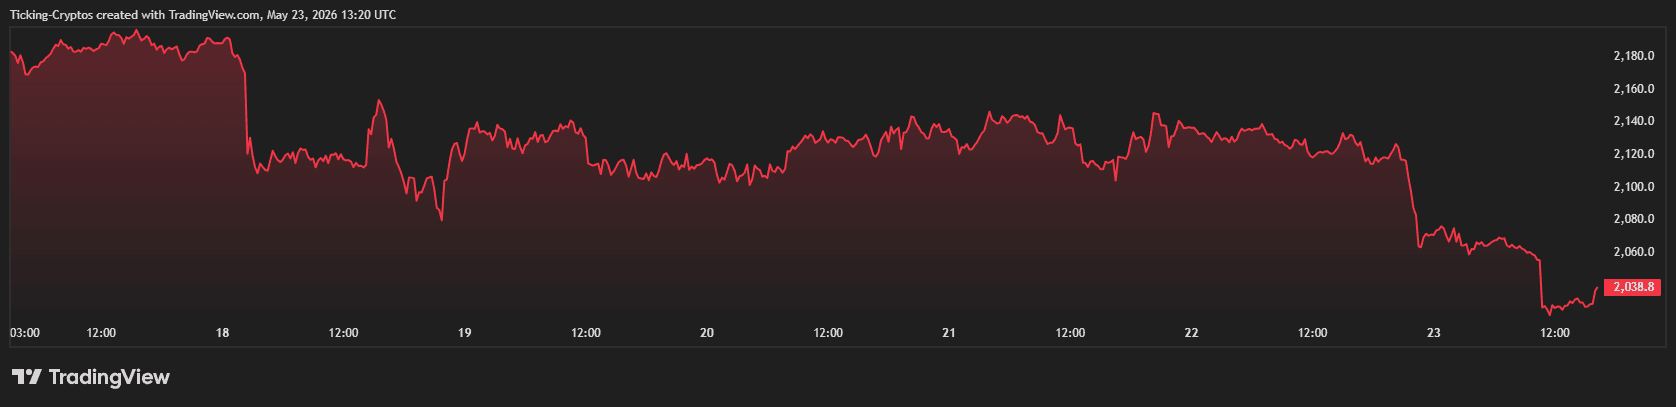
For traders watching the charts, the threat of Ethereum dropping below $2,000 is highly probable. Driven by a broader market liquidation, ETH has broken multiple short-term support levels over the last week. Whether the asset plunges below the psychological $2,000 mark depends entirely on technical defense at the current horizontal support and how rapidly global military and regulatory escalations unfold over the weekend.
What's Happening with Wars?
A crypto crash is rarely triggered by a single technical malfunction; it is almost always the byproduct of capital flight from risk assets due to major global developments. Today, two major geopolitical flashpoints are driving the sell-off:
1. The US-Iran Strike Threat and Inflation Risks
According to reports from CBS News, the United States is actively positioning assets for potential military strikes against Iran. This has severely choked commercial traffic through the crucial Strait of Hormuz. The imminent threat of an expanded conflict has driven crude oil prices upward, reigniting aggressive consumer price index (CPI) inflation fears. Consequently, expectations for Federal Reserve interest rate cuts have vanished, forcing investors to price in a prolonged hawkish era that drains liquidity from the crypto markets.
2. China's Massive Naval Deployment Near Taiwan
Adding heavy pressure to global markets, Taiwan's National Security Council Chief Joseph Wu confirmed that China has deployed over 100 navy, coast guard, and military vessels across regional waters stretching from the Yellow Sea to the South China Sea and Western Pacific. This aggressive military maneuvering follows a high-stakes summit in Beijing between U.S. President Donald Trump and Chinese President Xi Jinping, where the "Taiwan problem" took center stage.
Compounding the anxiety, the U.S. Navy officially paused a scheduled $14 billion weapons sale to Taiwan to conserve munitions for the worsening Middle East theater. This leaves the self-governed island exposed. A potential Chinese military blockade or attack on Taiwan threatens the heart of global semiconductor supply chains, forcing global markets into a defensive panic and accelerating capital flight out of alternative assets like Ethereum.
Ethereum Price Prediction: Will ETH Coin Crash?
A close examination of the daily ETH/USD chart reveals a distinctly bearish market structure that has been building momentum throughout the month.
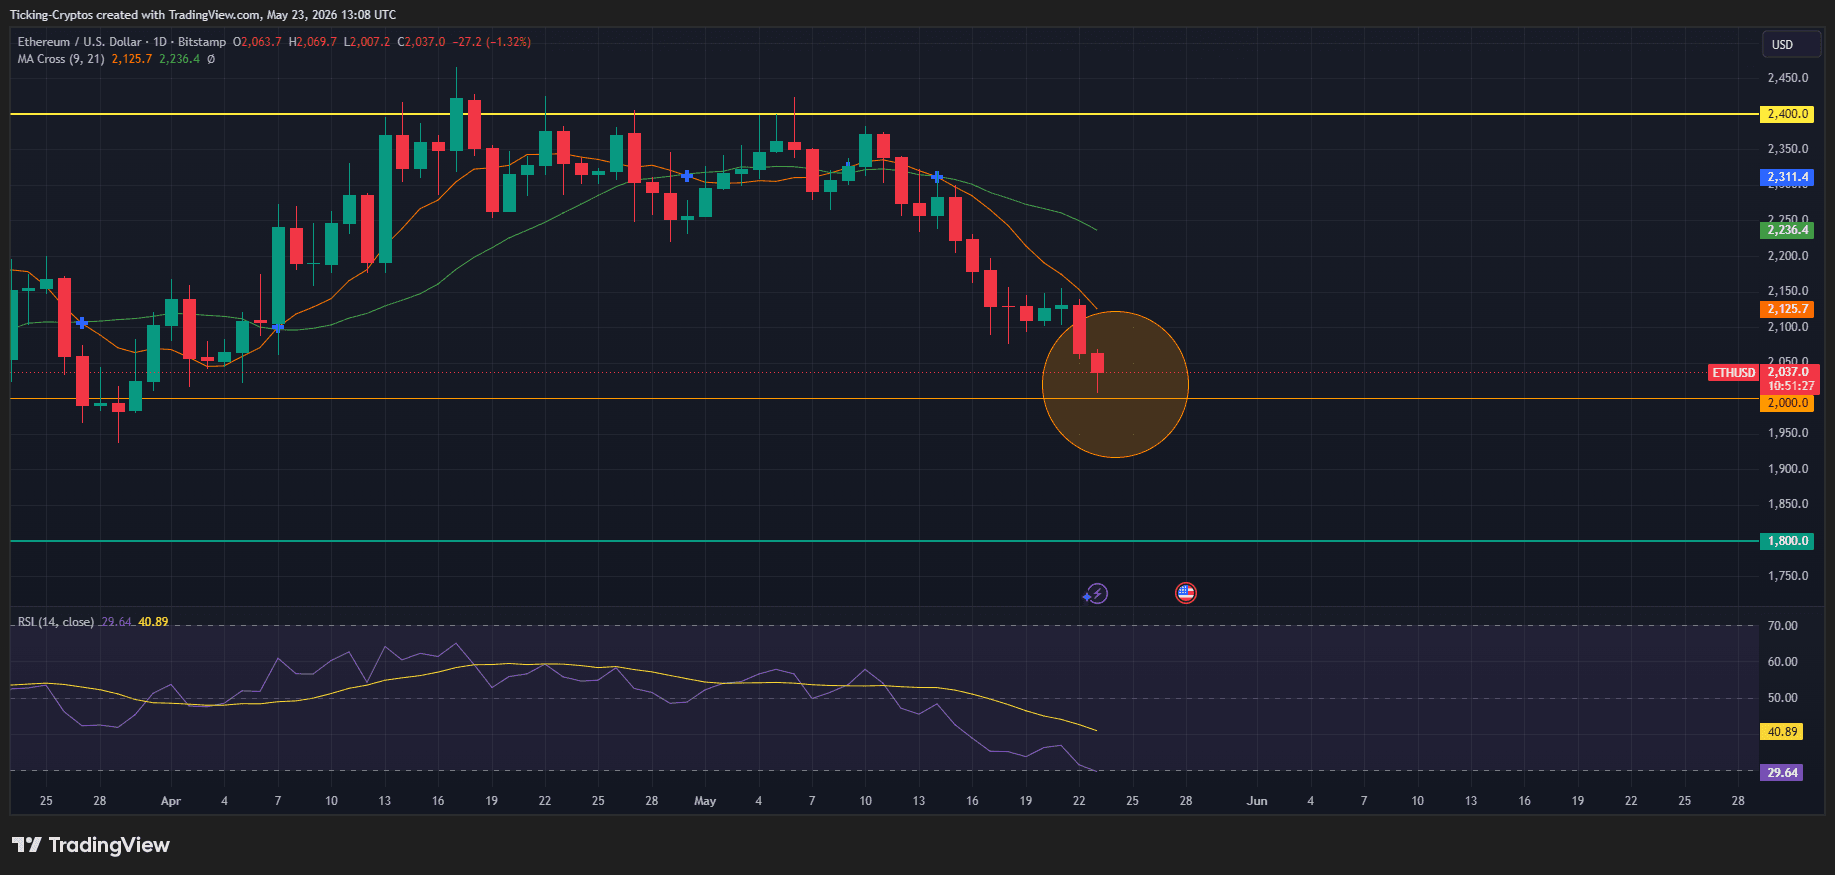
- Moving Average Cross Failure: The daily candles show a clear rejection from the 9-day and 21-day Moving Averages ($2,125 and $2,236 respectively). The faster moving average crossing below the slower tracker has acted as dynamic resistance, capping any attempts at a bullish relief rally.
- The Highlighted Drop Zone: As emphasized by the yellow highlight on the chart, Ethereum has printed consecutive, large-bodied red daily candles. This aggressive selling pressure has pushed the asset down to a current price of $2,037.
- RSI Breakdown: The Relative Strength Index (RSI) has plunged deeply into oversold territory, currently registering at 29.64. While an oversold RSI typically hints that a temporary bounce is due, in a high-volume macro sell-off, it can remain depressed while price continues to drift lower toward primary liquidity pools.
Traders looking to navigate this volatility and lock in liquidity can benchmark top-tier trading venues using our crypto exchange comparison.
Two Potential Market Scenarios for Ethereum
With the price hovering just above the critical psychological threshold, the market is facing two distinct structural paths over the coming days.
Scenario 1: The Bearish Breakdown Below $2,000
If the macroeconomic or geopolitical triggers worsen—such as the materialization of rumored military strikes in Iran or further naval incursions around Taiwan—the crypto market will face another wave of automated liquidations.
In this scenario, the immediate horizontal support line at $2,000 will break. Given the lack of dense historical order blocks immediately below $2,000, a breach of this level will likely trigger stop-losses and panic selling. This would swiftly drive the price down to test the major macro support line visible at $1,800 (marked by the green line on the chart), representing an additional 11% drop from the psychological boundary.
Scenario 2: The Oversold Support Bounce and Reversal
Conversely, if geopolitical tensions ease, the Strait of Hormuz reopens cleanly, and China de-escalates its naval positions, the technical setup favors a strong defensive stand by bulls.
The $2,000 level is a major structural pivot point. Because the RSI is already hovering in deeply oversold territory ($29.64), the selling pressure could exhaust itself right at the threshold. A successful defense of the $2,000 support would spark an aggressive short-squeeze, pushing Ethereum back up to retest the $2,125 resistance zone and the descending moving averages by next week.
Strategic Overview and Key Takeaways
| Metric / Level | Current Value / Zone | Market Significance |
|---|---|---|
| Current ETH Price | $2,037 | Hovering just 1.8% above the crucial pivot point. |
| Immediate Support | $2,000 | Psychological line; break triggers drop to $1,800. |
| Dynamic Resistance | $2,125 – $2,236 | Confluence of the 9-day and 21-day Moving Averages. |
| Primary Global Risks | Iran / Taiwan Strait | Dual-theater conflict threats drying up macro liquidity. |
As the market navigates this intense volatility, protecting your spot holdings from counterparty platform risk is vital. Reviewing cold-storage infrastructure via our hardware wallets comparison remains a recommended practice for risk management during market-wide crashes.
0
0

 Manage all your crypto, NFT and DeFi from one place
Securely connect the portfolio you’re using to start.

0
0

0
0

0
0
