Arbitrum price prediction 2024 – 2030: ARB breaks key barrier
3d ago•

bullish:
0
bearish:
0
Share

Key takeaways:
- Our ARB predictions anticipate a high of $1.099 by the end of 2024.
- In 2025, it will range between $0.923 and $1.04, with an average price of $0.962.
- In 2030, it will range between $6.12 and $7.07, with an average price of $6.29.
Layer 2s have made quite a buzz over the last few months because of their high network activity. Arbitrum led the Layer 2 pack with a total value locked (TVL) of $2.888 billion. Arbitrum is an Optimistic Rollup solution that shifts network operations away from the Ethereum mainnet while maintaining Ethereum-level security.
Also Read: Arbitrum Reaches All-Time High for Newly Created Addresses
Arbitrum’s BOLD testnet also went live; when integrated into the mainnet, the update will enable permissionless validation on Arbitrum. This means that anyone can challenge the state of the Arbitrum network. Currently, validators are allow-listed.
Is Arbitrum a good investment? Will it go up? Where will it be in 5 years? Let’s answer these questions and more in our Arbitrum price prediction.
Overview
| Cryptocurrency | Arbitrum |
| Ticker | ARB |
| Current price | $0.714 |
| Market cap | $2,306,105,701 |
| Trading volume | $379,758,53 |
| Circulating supply | 3,231,588,116 |
| All-time high | $2.40 on Jan 12, 2024 |
| All-time low | $0.70 on Jul 4, 2024 |
| 24-hour low | $0.7065 |
| 24-hour high | $0.7721 |
Arbitrum price prediction: Technical analysis
| Metric | Value |
| Volatility (30-day variation) | 11.98% |
| 50-day SMA | $0.9880 |
| 200-day SMA | $1.4576 |
| Sentiment | Bearish |
| Fear and Greed Index | 44 (Fear) |
| Green days | 13/30 (43%) |
Arbitrum price analysis: ARB registers new ATL
Key takeaways:
- ARB drops lower and into oversold territory
- ARB registers ATL at $0.699.
ARB/USD 1-day chart: ARB set for reversal

The William Alligator trendlines indicate high market volatility as ARB drops lower and into oversold territory. The chart shows ARB is in for a major reversal that could help investors offset some losses. If ARB bounces back into a bullish run following restored investor hope, it could potentially breach the $0.92 breaking point.
ARB/USD 4-hour chart: ARB registers ATL at $0.699.
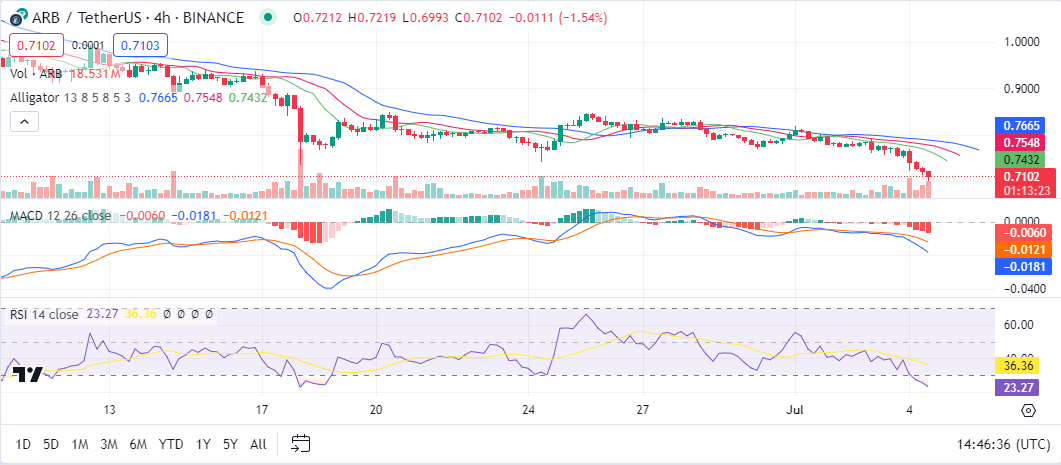
ARB has formed a three-black crow candle formation, a bearish continuation pattern forcing ARB to a new ATL in oversold territory at $0.699 registered on Binance. The $1.769 level is now a focal point, determining whether Arbitrum will recover to previous highs. The relative strength index (RSI) is in oversold territory, so there is room for a sharp reversal.
Arbitrum technical indicators: Levels and action
Daily simple moving average (SMA)
| Period | Value ($) | Action |
| SMA 3 | 0.8066 | SELL |
| SMA 5 | 0.7945 | SELL |
| SMA 10 | 0.8061 | SELL |
| SMA 21 | 0.8484 | SELL |
| SMA 50 | 0.9880 | SELL |
| SMA 100 | 1.1325 | SELL |
| SMA 200 | 1.4576 | SELL |
Daily exponential moving average (EMA)
| Period | Value ($) | Action |
| EMA 3 | 0.8107 | SELL |
| EMA 5 | 0.8123 | SELL |
| EMA 10 | 0.8250 | SELL |
| EMA 21 | 0.8759 | SELL |
| EMA 50 | 0.9877 | SELL |
| EMA 100 | 1.1417 | SELL |
| EMA 200 | 1.2605 | SELL |
What can we expect from ARB price analysis next?
Per our analysis, Arbitrum is bearish, with the Fear & Greed Index showing investors are fearful as it drops lower into oversold territory. The direction of the next breakout is potentially bullish; however, a lower breakout also remains plausible. Looking ahead, let’s explore the ARB price prediction from 2024 to 2030.
Is Arbitrum a good investment?
Arbitrum is a leading Layer 2 blockchain with an impressive TVL. The network also achieves development milestones, like quadrupling transactions after integrating EIP-4844, which cuts transaction costs by 90%. Despite a gloomy month, price predictions suggest a different narrative.
Why is Arbitrum down?
Arbitrum’s current drop is inconsistent with the network’s activity. The coin’s drop this year is consistent with the drop in crypto market valuation.
Will Arbitrum recover?
Arbitrum has formed a new ATL and indicates the potential to drop lower; despite this, network participation has remained consistently high, and as a result, Daily active addresses (DAA) have remained relatively high. This suggests AR will eventually recover. These indicators point to an eventual recovery.
Will Arbitrum reach $1?
Aribtrum’s 100-day SMA is above $1, meaning ARB is oversold and has the potential to rise above its value within the coming three months.
Will Arbitrum reach $10?
According to Cryptopolitan price predictions, it is unlikely that ARB will trade at $10 in the period ending in 2030.
Will Arbitrum reach $100?
According to Cryptopolitan price predictions, it is unlikely that ARB will trade at $100 in the period ending in 2030.
Does Arbitrum have a good long-term future?
A high adoption rate is crucial for any blockchain’s long-term success and sustainability. Arbitrum’s performance in this regard is a positive sign of its future performance despite the price declines.
Recent news/ updates
Open Campus has announced receiving a grant from the Fondazione Arbitrum to launch EDU Chain, the first layer3 blockchain for education. Animoca Brands, among others, supports the project.
ARB price prediction July 2024
The Arbitrum price forecast in July is a maximum price of $1.022 and a minimum price of $0.699. The average price for the month will be $0.867.
| Month | Potential low ($) | Potential average ($) | Potential high ($) |
| July | 0.699 | 0.867 | 1.022 |
ARB price prediction 2024
For the second half of 2024, ARB’s price will range between $0.699 and $1.0995. The average price for the period will be $0.995.
| Year | Potential low ($) | Potential average ($) | Potential high ($) |
| 2024 | 0.699 | 0.995 | 1.099 |
Arb price prediction 2025-2030
| Year | Potential low ($) | Potential average ($) | Potential high ($) |
| 2025 | 0.923 | 0.962 | 1.04 |
| 2026 | 1.36 | 1.41 | 1.59 |
| 2027 | 2.01 | 2.07 | 2.41 |
| 2028 | 2.93 | 3.01 | 3.57 |
| 2029 | 4.17 | 4.29 | 4.98 |
| 2030 | 6.12 | 6.29 | 7.07 |
Arbitrum price prediction 2025
The Arbitrum price forecast for 2025 is a high of $1.04. It will reach a minimum price of $0.923 and an average price of $0.9621.
Arbitrum price prediction 2026
The year 2026 will be bullish. Our Arbitrum price prediction estimates it will range between $1.36 and $1.59, with an average trading price of $1.41.
Arbitrum price prediction 2027
Arbitrum’s price prediction climbs even higher into 2027. According to the prediction, ARB’s price will range between $2.93 and $3.57, with an average price of $3.01.
Arbitrum price prediction 2028
Our analysis indicates a further acceleration in ARB’s price. It will trade between $4.17 and $4.98 and an average of $4.29.
Arbitrum price prediction 2029
According to the 2029 ARB price prediction, the price of ARB will range between $6.12 and $7.07, with an average price of $6.29.
Arbitrum price prediction 2030
The ARB price prediction for 2030 indicates the price will range between $8.39 and $10.60. The average price of ARB will be $8.71.

ARB market price prediction: Analyst’s ARB price forecast
| Platform | 2024 | 2025 | 2026 |
| Digitalcoinprice | $1.48 | $1.80 | $2.48 |
| Changelly | $1.45 | $1.41 | $2.07 |
| Gate.io | $0.78 | $0.87 | $1.07 |
Cryptopolitan’s ARB price prediction
Our predictions show that ARB will achieve a high of $1.099 in the second half of 2024. In 2025, it will range between $0.923 and $1.04, with an average of $0.962. In 2030, it will range between $6.12 and $7.07, with an average of $6.29. Note the predictions are not investment advice. Seek independent professional consultation or do your research.
Arbitrm historic price sentiment
- The Arbitrum airdrop snapshot occurred on Feb 6, 2023, and eligible participants started claiming on Mar 23, 2023. The claiming period ended on Sep 24, 2023.
- The airdrop granted 11.5% of the total supply to eligible users, 1.1% to DAOs operating in the Arbitrum ecosystems, and 44% to employees and Offchain Labs investors. The 44% is subject to lock-up periods and a vesting schedule. The rest was sent to the Arbitrum DAO treasury.
- On Sep 11, 2023, it fell to its all-time low at $0.7453.
- Bitcoin halving and crypto ETF hype helped the coin recover from October. By the end of the year, it had risen to $1.4.
- The run continued into 2024. On Jan 12, it reached its all-time high at $2.40.
- Per Coinmarketcap data, ARB broke below its listing price in June 2024.
- This month it registered a new all-time low, breaking the previous record set in Sep 2023 at $0.7453.

3d ago•
bullish:
0
bearish:
0
Share


 Manage all your crypto, NFT and DeFi from one place
Securely connect the portfolio you’re using to start.

bullish:
0
bearish:
0


bullish:
0
bearish:
0
