
Dogecoin Price Prediction: $DOGE 5-Year Breakout Zone, Upcoming Rally?

0
0

DOGE has been sliding for weeks, yet trading volume tells a different story.
Dogecoin is the original meme coin, built as a joke that grew into one of the largest cryptocurrencies by market cap.
This Dogecoin Price Prediction looks at where DOGE stands today and what the EMA cluster and key support and resistance levels say about the next move.
Market data was checked on August 18, 2026, at 14:46 IST.
Dogecoin Price Prediction Today: Market Overview
Metric | Value |
Price | $0.06992 |
24 Hr Change | -0.50% |
Market Cap | $10.85B |
FDV | $11.95B |
24h Volume | $287.96M+ |
Vol/Mkt Cap (24h) | 2.45% |
Total Supply | 171.25B $DOGE |
Max Supply | No cap |
Circulating Supply | 155.54B $DOGE |
Source: Data from CoinMarketCap as of August 18, 2026, at 14:46 IST. Figures may vary slightly across other tracking websites.
DOGE News: Resilience Despite the Decline
A post from BSCN notes that DOGE has declined about 3.2% over the last 30 days and 32.9% over the last 90 days but frames the asset as resilient despite that stretch.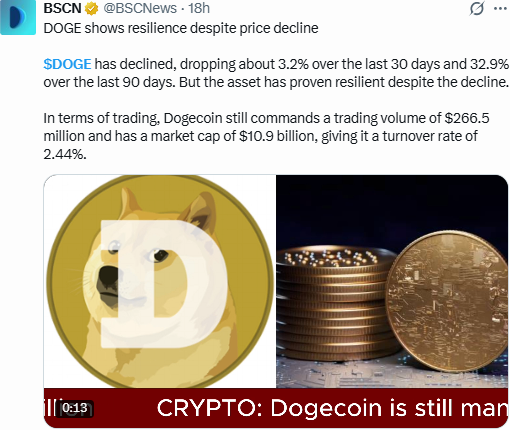
The post puts trading volume at $266.5 million against a market cap of $10.9 billion, working out to a turnover rate of 2.44%.
Read alongside the 90-day drop, the takeaway is that DOGE hasn't seen trading activity collapse the way price has, which is generally a healthier sign than a decline paired with disappearing volume.
DOGE Coin Crypto News: The Most Important Level in 3 Years
A post from an analyst account that DOGE is about to hit its most important level in three years. 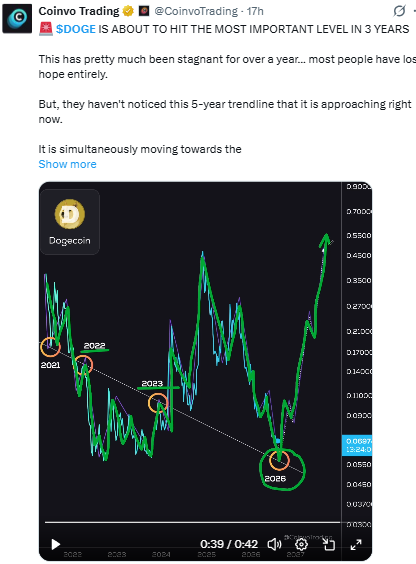
Source: Data From X
Their view: DOGE has been largely stagnant for over a year, with most traders having given up on it, but few have noticed that price is simultaneously approaching a 5-year descending trendline, stretching back through the 2021, 2022, and 2023 swing highs, right as it nears its historical bottom zone.
The post also argues that most meme coins are effectively dead, with only a handful, DOGE included, still standing.
Note: This is one analyst's chart reading rather than confirmed data, and it's worth treating it as a perspective on the setup rather than a guaranteed outcome.
DOGE Price Prediction Today: Technical Analysis
Pair: DOGE/USDT · Market: Spot · Exchange: KuCoin · Timeframe: 4H · Source: TradingView · Timestamp: August 18, 2026, 14:46 UTC+5:30
DOGE is trading at $0.06992, consolidating inside a shaded range between the first confirmed support and nearest resistance after pulling back from a spike above $0.0720 on August 12.
RSI (Relative Strength Index) reads 47.31, close to the neutral 50 mark, showing the market is fairly balanced right now with no strong directional push either way.
The EMA (Exponential Moving Average) cluster sits just above the current price and is unusually tight, with the EMA 20 at $0.07007 and the EMA 50 at $0.07012, both acting as immediate resistance for price to clear before it can test the range's upper boundary.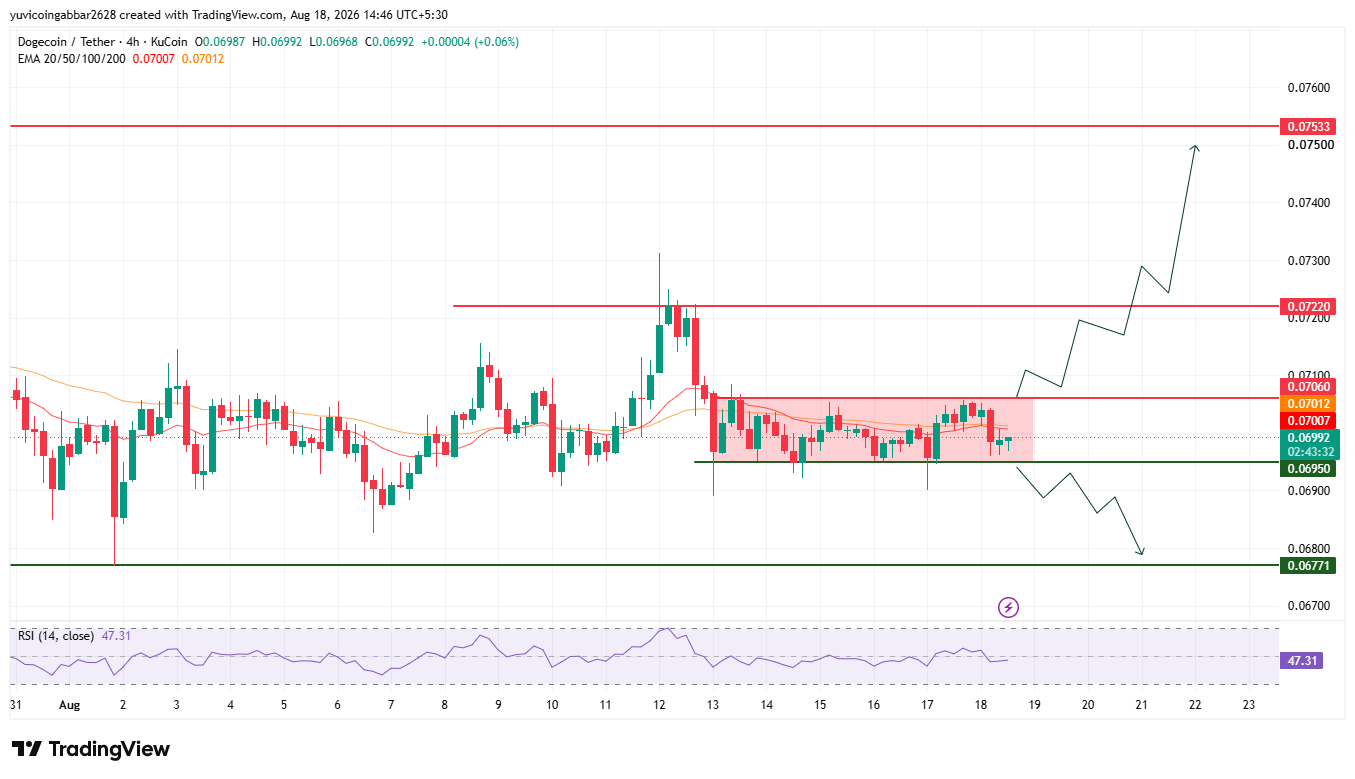
$DOGE future price: Key Levels to Watch
Level Type | Price |
Resistance 3 | $0.07533 |
Resistance 2 | $0.07220 |
Resistance 1 (nearest) | $0.07060 |
Immediate Price Reference | $0.06992 |
First Support | $0.06950 |
Deeper Support | $0.06771 |
$DOGE EMA Levels
EMA | Price |
EMA 20 | $0.07007 |
EMA 50 | $0.07012 |
Dogecoin Forecast: Bull Case vs Bear Case
$DOGE price target 2026 Bull case: Clearing the tight EMA cluster near $0.07007 to $0.07012 and holding above the first confirmed support at $0.06950 would open the path toward the nearest resistance at $0.07060, then $0.07220 and $0.07533.
$DOGE price target 2026 Bear case: A break below $0.06950 would put the current range at risk and bring the deeper support at $0.06771 into view.
If DOGE fails to hold here while also testing that multi-year trendline from below, it would add technical weight to the view that the "most important level in 3 years" is breaking rather than holding.
Price Scenarios: Triggers and Invalidation
Scenario | Trigger | Likely Outcome | Invalidation Point |
EMA reclaim | Close above $0.07012 | The path opens toward $0.07060, $0.07220, and $0.07533 | Rejection back below $0.07007 |
Range hold | Price stays between $0.06950 and $0.07060 | Consolidation continues near current levels. | Close below $0.06950 |
Range breakdown | Close below $0.06950 | Drop toward $0.06771 | Reclaim of $0.06950 |
$DOGE Price Target: Can $DOGE Reach $0.07533?
$0.07533 is the highest resistance level marked on the chart.
Reaching it would require $DOGE to first clear the tight EMA cluster near $0.07007 to $0.07012, hold above the first confirmed support at $0.06950, then break and hold above the nearest resistance at $0.07060 and $0.07220.
A multi-stage move rather than a single leg, especially with the broader trendline test still unresolved on the higher timeframe.
What Could Invalidate the Bullish Setup?
A rejection at the EMA cluster near $0.07007 to $0.07012 followed by a close back below the first confirmed support at $0.06950 would put the current range in doubt.
A deeper break below $0.06771 would undermine the setup entirely and, combined with a failed hold at the long-term trendline, would support the more bearish reading of $DOGE's current position.
Dogecoin Price Prediction 2026: Expert Analysis
According to CoinGabbar analysts, $DOGE's short-term chart is tight and fairly balanced, with an RSI at 47.31 and an EMA cluster barely a few pips wide show a market waiting for a trigger rather than committing to a direction.
A much bigger question raised by the post: $DOGE is simultaneously testing a 5-year trendline and its historical bottom zone, a combination that, if accurate, makes the next move on higher timeframes more consequential than the usual range trade.
The BSCN data adds some reassurance, volume has held up even as price slipped over the past 90 days, which is generally a sign of participation rather than abandonment.
The $0.06950 to $0.07060 zone is the level to watch first, with the bigger trendline story playing out above and below it.
Disclaimer: This piece is for informational purposes only and isn't financial advice. The levels and scenarios above are based on technical chart analysis and publicly available data at the time of writing, and crypto markets can move sharply within hours, so past patterns don't guarantee future outcomes. It's worth doing independent research and considering your own risk tolerance before acting on any of the levels discussed here.
0
0

 Manage all your crypto, NFT and DeFi from one place
Securely connect the portfolio you’re using to start.


0
0


0
0