
Cardano Price Prediction: Fresh Buy Signal Puts ADA Breakout In Play

0
0

Cardano launched in 2017 as a proof-of-stake blockchain network, with $ADA as its native token. ADA is currently trading around $0.2046 right now, up 3.4% on the day.
Market cap works out to roughly $7.67 billion, keeping Cardano near rank #19 among all cryptocurrencies.
The rest of this Cardano price prediction breaks down where ADA might go from here.
Live Market Data
Metric | Value |
Price | $0.2046 |
24h Change | +3.4% |
24h Range | $0.1921 – $0.2073 |
Market Cap | $7.67B |
Fully Diluted Valuation | $9.203B |
24h Trading Volume | $387.457M |
Circulating Supply | 37.504B |
Total / Max Supply | 45B |
Source: ADA market cap data taken from CoinGecko, data as of Sep 03, 2026. Figures may vary slightly across other tracking websites.
Exchange Volume
Most of ADA's futures volume is sitting on a small group of exchanges. Binance tops the list at $154.53M over 24 hours, with Bybit ($60.05M) and BingX ($52.98M) next in line. 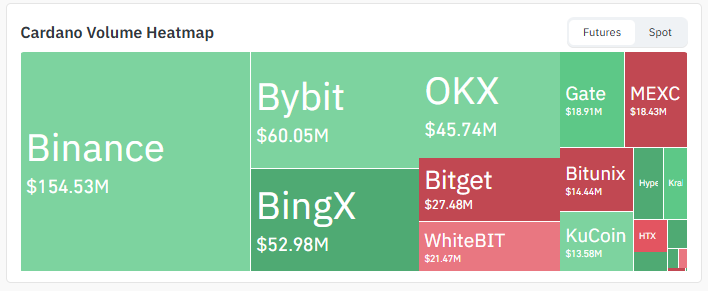
Source: Volume Heatmap Data Taken From CoinGlass, As of Sep 3, 2026
OKX adds another $45.74M. Bitget, WhiteBIT, Gate, MEXC, Bitunix, and KuCoin fill out the rest, each somewhere between $13M and $28M.
Liquidity looks solid enough across the board for this kind of price move to hold up.
Liquidation Snapshot
Shorts have taken the brunt of it as ADA pushed higher.
Total liquidations over 24 hours hit $1.09M, and short positions made up $781.78K of that against just $309.23K on the long side.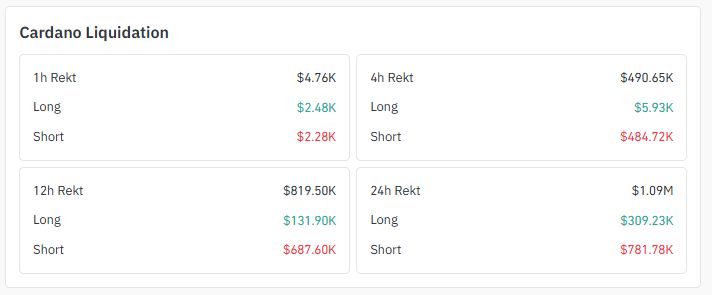
Source: Liquidation Data Taken From CoinGlass, As of Sep 3, 2026
Zoom into the 12-hour window, and the pattern repeats: $687.60K in shorts wiped out compared to $131.90K in longs.
Squeezes like this tend to line up with sharp bounces off support, which fits what's happening on the chart right now.
Key Takeaways
-
$ADA is trading near $0.2046, up 3.4% in the last 24 hours, after bouncing off its 21-day and 55-day EMA cluster.
-
The daily chart shows price still contained inside a rising ascending channel that has held since the recent low.
-
A TD Sequential buy signal on the daily chart is drawing analyst attention, with similar signals preceding past rallies.
-
A confirmed close above $0.2585 could open the door toward $0.2832 and $0.3145 in this Cardano price prediction.
-
Rejection at the upper boundary and the 200-day EMA near $0.2437 keeps $0.1619 and $0.1383 in play on the downside.
Technical Analysis
Ascending Channel Structure
Zoom out on the daily chart, and $ADA has been climbing inside a fairly clean ascending channel for weeks now. Buyers keep showing up near the rising trendline on every pullback. 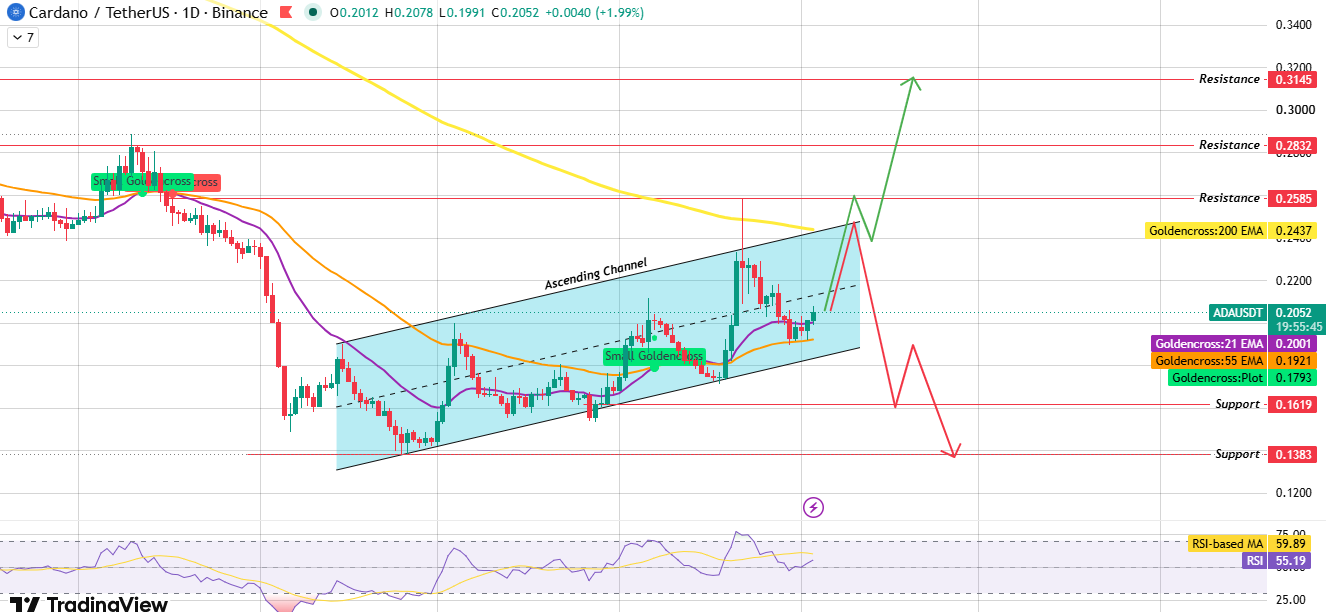
Source: Chart Taken From TradingView , As of Sep 3, 2026
The latest dip was no different. It dragged the price straight into the 21-day and 55-day EMA zone, roughly between $0.1921 and $0.2001, and that's exactly where the bounce began. Not a coincidence.
That zone lines up almost perfectly with the channel's lower boundary, which has been doing the heavy lifting as support through this entire move.
EMA Cluster and Momentum
Two EMAs worth watching here: the 21-day at $0.2001, sitting just above the 55-day at $0.1921.
When price reclaims that cluster, traders usually read it as a short-term bullish tell, since it means buyers stepped in before price even reached the channel's midpoint.
RSI is at 55.19, still below its own moving average of 59.89.
So momentum is picking back up but hasn't run hot yet, and there's some runway left before RSI itself turns into resistance.
Breakout and Rejection Scenarios
Here's the setup for a genuine breakout: a full daily candle closing above $0.2585, backed by volume that clears the recent 20-day average.
Get that combination, and the channel's upper boundary is broken, with $0.2832 as the first stop and $0.3145 not far behind in this ADA price prediction.
The other side of the coin looks different. If ADA gets turned away at $0.2585 and can't reclaim the 200-day EMA at $0.2437, either way, the bullish case starts to fall apart.
A close below the channel's rising lower boundary after that would confirm the breakdown, with $0.1619 as the first level and $0.1383 waiting underneath it.
Support and Resistance Levels (Daily Chart)
| Level Type | Price |
| Resistance 3 | $0.3145 |
| Resistance 2 | $0.2832 |
| Resistance 1 | $0.2585 |
| Support 1 | $0.1619 |
| Support 2 | $0.1383 |
EMA Levels (Daily Chart)
EMA | Price |
200-day EMA | $0.2437 |
55-day EMA | $0.1921 |
21-day EMA | $0.2001 |
Levels reference the 1-day candle close on the ADA/USDT chart, Binance, UTC.
Bull, Base, and Bear Case for ADA
| Scenario | Trigger | Price Targets |
| Bull Case | The daily candle closes above $0.2585 with volume above the recent average, confirming a break of the ascending channel's upper boundary | $0.2832, then $0.3145 |
| Base Case | ADA continues to oscillate inside the ascending channel, holding between the EMA cluster support and channel resistance | Range-bound between $0.1921–$0.2001 and $0.2585 |
| Bear Case | Price is rejected near $0.2585 and also fails to reclaim the 200-day EMA at $0.2437, then closes below the channel's rising lower boundary | $0.1619, then $0.1383 |
Cardano News
Analyst Ali Charts pointed out a fresh TD Sequential buy signal on Cardano's daily chart.
Worth noting: similar signals have called recent bottoms before, including moves in late June, mid-July, and mid-August. 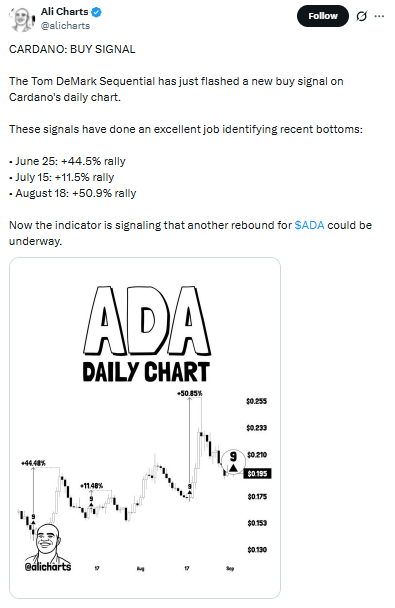
Source: Data Taken From @alicharts , X Account, As of Sep 03, 2026
Whether this one plays out the same way is another question.
A single indicator, however good its recent track record, works best as part of a bigger picture rather than a signal to trade on its own.
Market Pulse
Put the pieces together: a 3.4% daily gain, short liquidations running well ahead of longs, and it looks like the market was leaning bearish going into this bounce and got caught offside.
Volume is still concentrated on the bigger exchanges, RSI has room before it gets overbought, and traders are watching the same two zones:
The EMA cluster below and channel resistance above.
Glossary
Ascending Channel: Two upward-sloping trendlines running roughly parallel, with price bouncing between them. Traders lean on the lower line for support and the upper one as a resistance zone to watch.
Exponential moving averages : weigh recent candles more heavily than older ones, so they turn faster than a simple moving average when price shifts direction. That's why short-term traders lean on EMAs more than longer, slower-moving lines.
RSI: Short for Relative Strength Index. It's a 0-100 oscillator built to measure how fast and how far price has moved recently, and it's most useful for spotting when a move has gotten overextended.
Getting liquidated means a leveraged futures position gets force-closed because there isn't enough margin left to cover the loss.
When liquidations pile up heavily on one side, shorts in this case, the resulting scramble to close out can actually push price further in that same direction.
TD Sequential: A counting-based indicator from Tom DeMark. It tracks a sequence of price bars to flag points where a trend may be running out of steam, often used to catch reversals a little earlier than price action alone would show.
Methodology
Chart structure and price levels in this piece come straight off a daily ADA/USDT chart on Binance, pulled through TradingView, and that covers the ascending channel, the EMA readings, and RSI.
Price, market cap, and supply numbers were sourced from a live market data aggregator at the time of writing.
Volume figures reflect a 24-hour futures snapshot across major exchanges, and the liquidation numbers come from a derivatives analytics dashboard.
Nothing here goes beyond what the chart actually shows.
No invented levels, no rounding up. Where a breakout or breakdown gets mentioned, it's tied to a specific close-and-volume condition, not offered as something guaranteed to happen.
Every level in this article is one possible outcome among several, and how ADA actually behaves at these levels will decide which one plays out.
Disclaimer: This Cardano price prediction draws on technical chart analysis and publicly available market data, and it isn't financial advice. ADA is volatile, and price could fall well below the support levels covered here, including a drop past $0.1383 if broader market conditions sour. Past patterns and indicator signals don't guarantee what happens next, and actual price action may look nothing like the scenarios above. Do your own research and weigh your own risk tolerance before acting on any of this.
0
0

 Manage all your crypto, NFT and DeFi from one place
Securely connect the portfolio you’re using to start.


