3 Hidden Gem Altcoins That May Increase and Surprise Investors in December
4
0

Bitcoin (BTC) and numerous prominent altcoins increased substantially in November and the start of December, culminating in BTC achieving a new yearly high on Dec. 5.
This article will examine lesser-known altcoins exhibiting bullish patterns, potentially paving the way for substantial profits in the upcoming month. The focus will be on cryptocurrencies ranked between 150 and 350 in market capitalization.
PAAL AI (PAAL) Begins Bullish Cycle
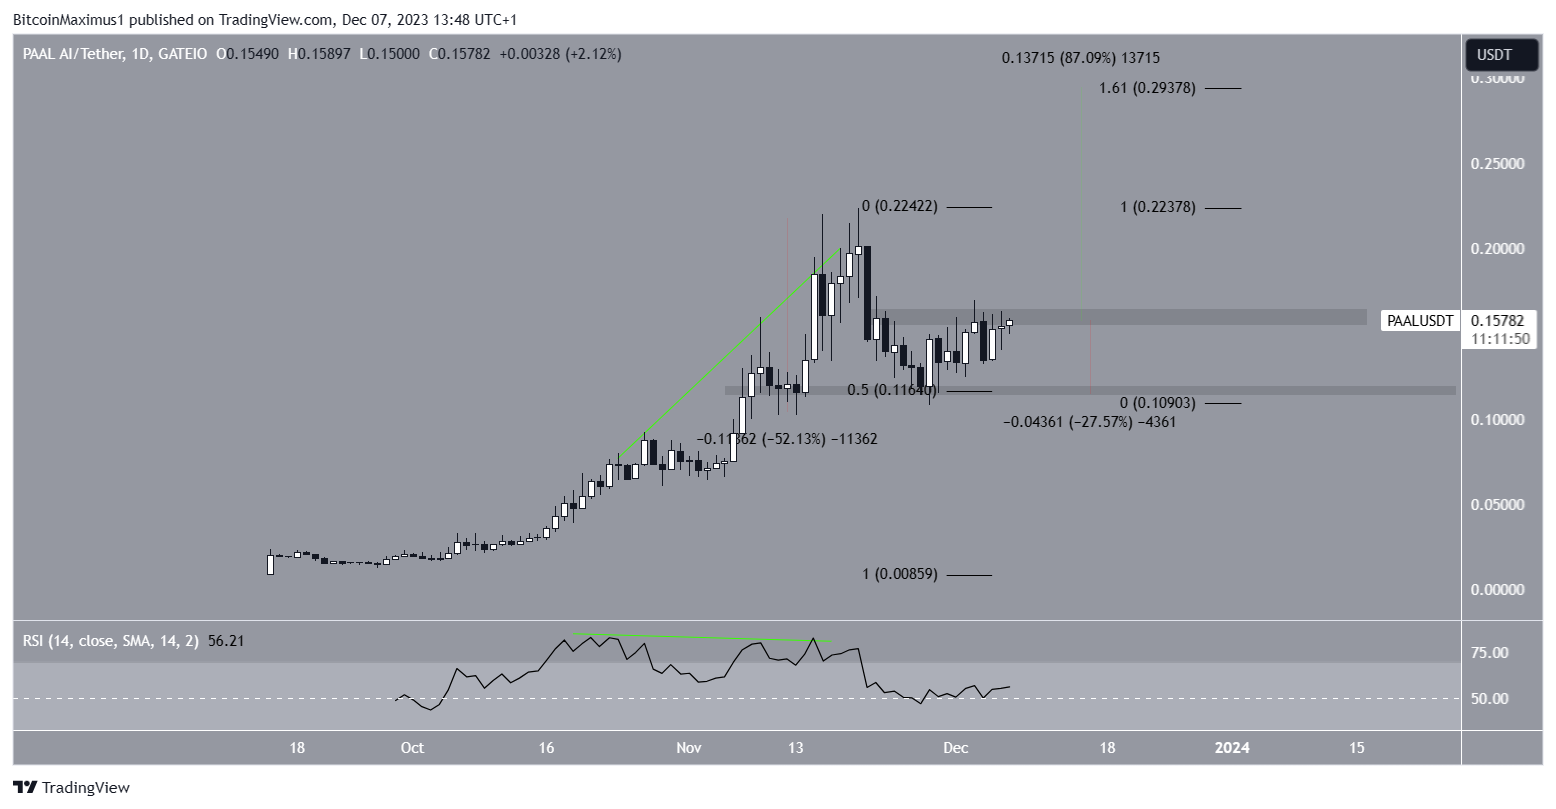
The PAAL price has increased quickly since Sept. 15. The upward movement culminated with a new all-time high of $0.22 on Nov. 20.
The pace and formation of the increase suggest that the price has begun a new bullish trend.
Starting in October and leading to the all-time high, the Relative Strength Index (RSI) generated a bearish divergence (green).
Market traders use the RSI as a momentum indicator to identify overbought or oversold conditions and to decide whether to accumulate or sell an asset. Readings above 50 and an upward trend indicate that bulls still have an advantage, whereas readings below 50 suggest the opposite.
A bearish divergence occurs when a momentum decrease accompanies a price increase. Significant corrections often follow it, as was the case with PAAL.
After the divergence, the altcoin fell by 50%, validating the 0.5 Fib retracement support level, which is also a horizontal support area.
As a result, it is possible that the correction is complete, and PAAL will resume its previous bullish trend.
Currently, the price is attempting to break out from the $0.16 horizontal resistance area. It could increase by 90% to the next resistance at $0.29 if successful.
 PAAL/USDT Daily Chart. Source: TradingView
Despite this bullish PAAL price prediction, a rejection from the $0.16 area can trigger a 26% drop to the next closest support at $0.11.
Read More: 9 Best AI Crypto Trading Bots to Maximize Your Profits
DENT Breaks out From Long-Term Resistance
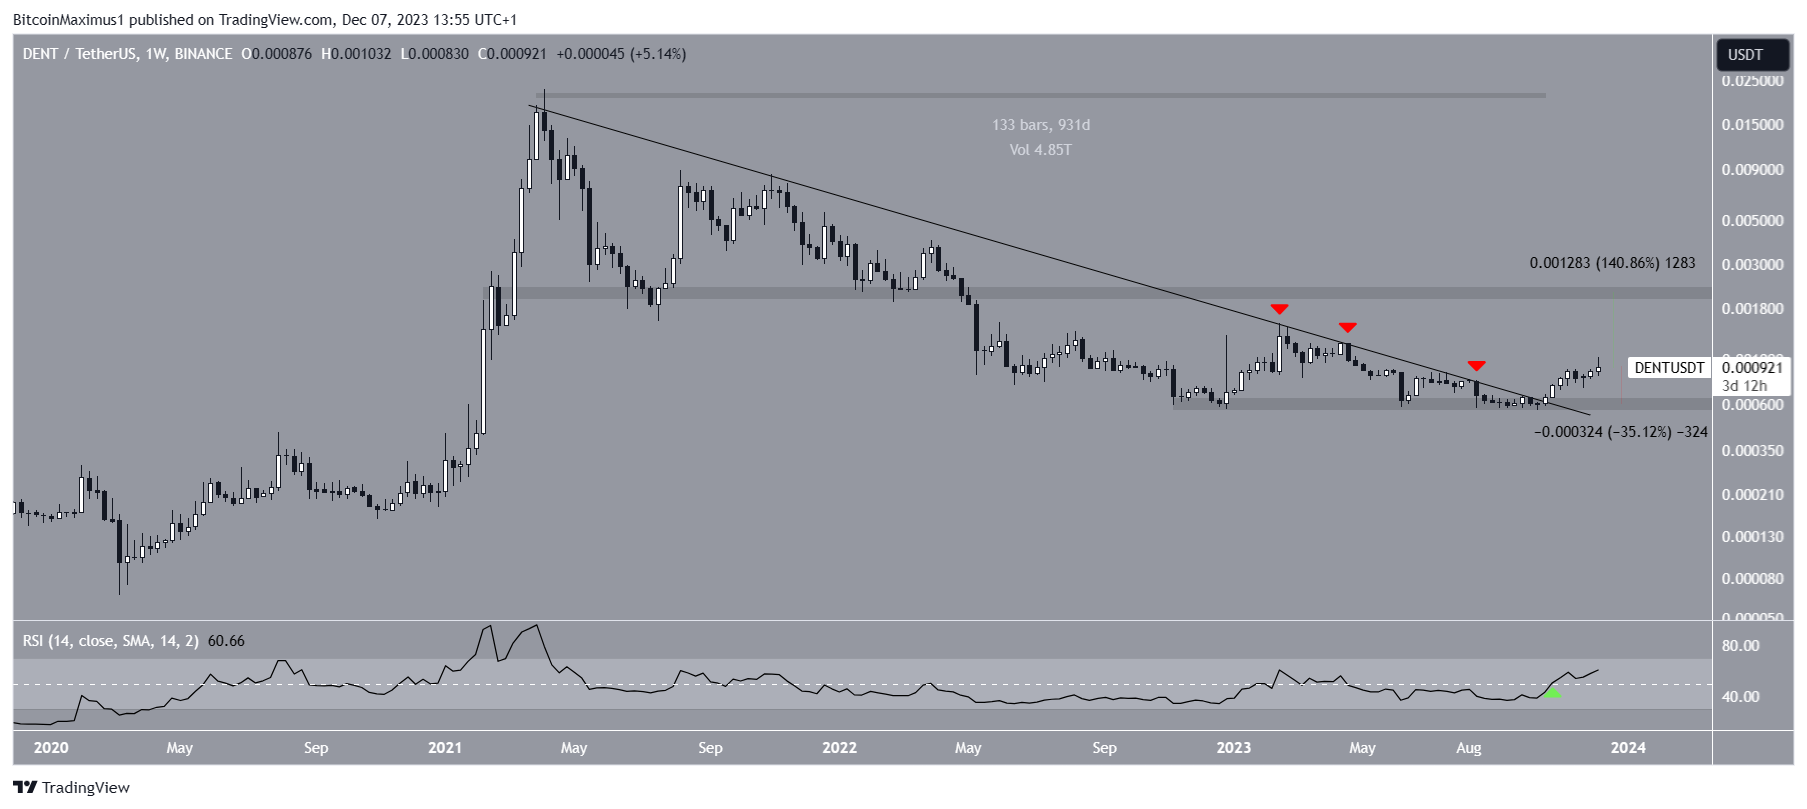
The DENT price has fallen under a descending resistance trend line since March 2021. The decrease culminated with a low of $0.00056 in December 2022.
Afterward, the altcoin made several failed attempts at breaking out (red icons) before creating a higher low in August 2023. The price broke out in October, after the trend line had been in place for 930 days.
Read More: 9 Best Crypto Demo Accounts For Trading
Breakouts from such long-term structures often precede significant upward movements.
Moreover, the weekly RSI supports the ongoing breakout. The indicator is above 50 and increasing (green icon), both considered signs of a bullish trend.
If the altcoin continues to increase, the next closest resistance will be at $0.0022, 140% above the current price.
 DENT/USDT Weekly Chart. Source: TradingView
Despite the bullish DENT price prediction, failure to sustain the increase and the creation of a bearish weekly candlestick can risk upward movement. The DENT price could fall by 35% to the closest support at $0.0006 in that case.
SuperVerse (SUPER) Concludes Hidden Gem Altcoins
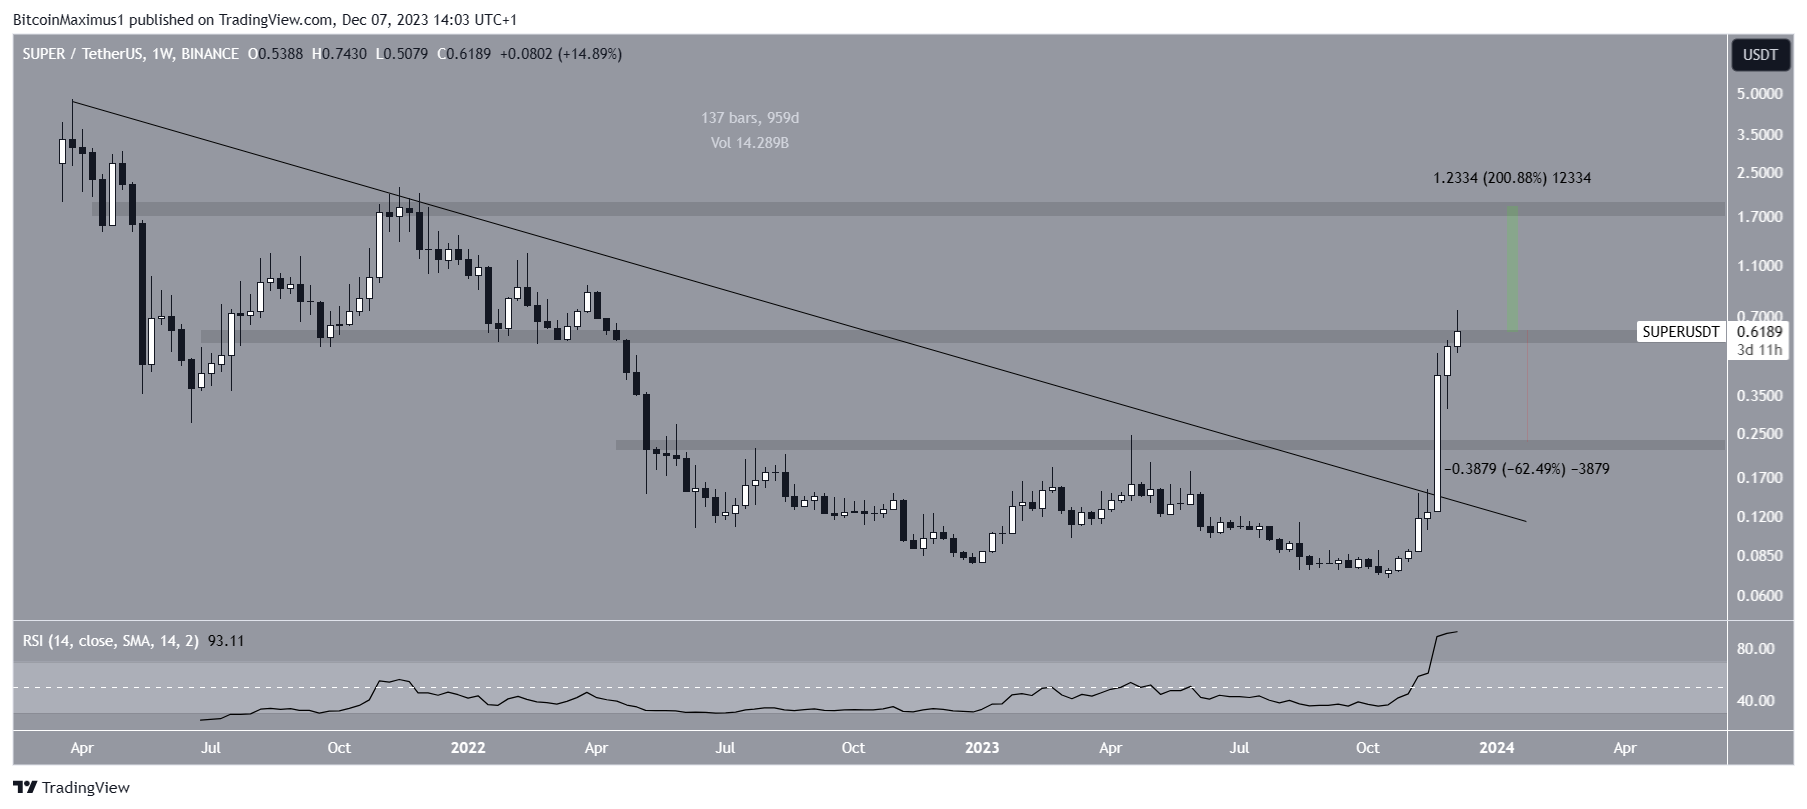
The final altcoin with the potential for considerable increases in December is SuperVerse. The SUPER price had decreased under a long-term descending resistance trend line since March 2021. The decrease led to a low of $0.069 in October.
Since then, the SUPER price has created eight successive bullish weekly candlesticks. This caused a breakout from the trend line, which had been in place for 960 days.
Read More: Top 9 Telegram Channels for Crypto Signals in 2023
The breakout is supported by the RSI, which is increasing and is above 50.
Currently, the altcoin trades inside the $0.60 horizontal resistance area. If it breaks out, the price can increase by another 200% and reach the next resistance at $1.75.
 SUPER/USDT Weekly Chart. Source: TradingView
Despite this bullish SUPER price prediction, a rejection from the $0.60 area can cause a 60% drop to the closest support at $0.23.
For BeInCrypto’s latest crypto market analysis, click here.
4
0


