Launch of Ethereum ETFs Announced, Crypto Rebounds Over 20%! Analysis from July 17, 2024
2h ago•

bullish:
0
bearish:
0
Share
After reaching the lower part of its range, Ethereum rebounded by nearly 22%. Let’s examine together the future outlook for ETH.

Situation of Ethereum (ETH) Price
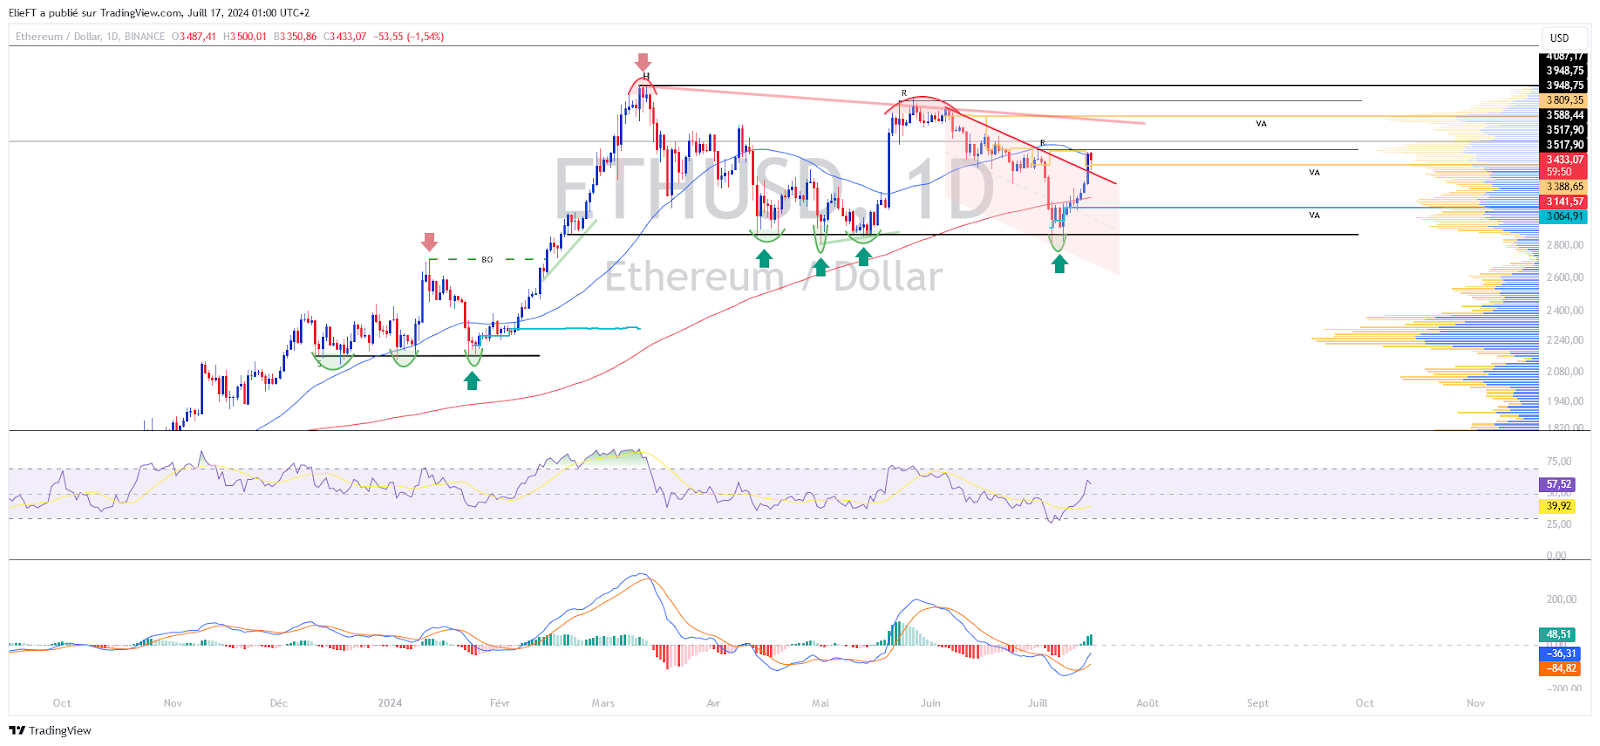
After reaching the lower part of its range around $2,900, a zone mentioned in the bearish hypothesis of the analysis of June 26, Ethereum attracted buying interest allowing it to rebound by more than 22%. In less than two weeks, the crypto price regained $3,500. It seems that this increase was accelerated by the announcement of the launch of Ethereum spot ETFs. Now, ETH has stabilized around its resistance. The most significant value zones are located on both sides of the crypto: below the current price, one can note $3,065. Above, one can identify the $3,800 zone.
A value zone is a price range rich in volumes that can act as a key level for investors.
At the time of writing this text, the price of Ethereum is trading just below $3,500. The latest fluctuations of ETH show a short-term bearish trend on the verge of being reversed, which could thus signal a continuation of the medium and long-term bullish trend of the crypto. These statements can be supported by the fact that Ethereum has managed to reposition itself above the 200-day moving average. Unsurprisingly, the dynamics of Ethereum have resumed with more fervor, as evidenced by its price and oscillators. All these elements undeniably demonstrate a resurgence of buying interest in Ethereum.
The current technical analysis was carried out in collaboration with Elie FT, an investor and passionate trader in the cryptocurrency market, now an instructor at Family Trading, a community of thousands of proprietary traders active since 2017. There, you will find Lives, educational content, and mutual support around financial markets in a professional and friendly atmosphere.
Focus on Derivatives (ETHUSDT)
The open interest in perpetual contracts on Ethereum seems to have followed the trajectory of its underlying asset’s price. This indicates an increase in speculative activity on ETH. Considering Ethereum’s recent rise, the predominantly seller liquidations, as well as a positive funding rate, the optimism surrounding Ethereum is evident. One can naturally conclude that this interest in ETH/USDT contracts is mostly buying-oriented, thus reinforcing the conviction of continuing the bullish momentum of the cryptocurrency.

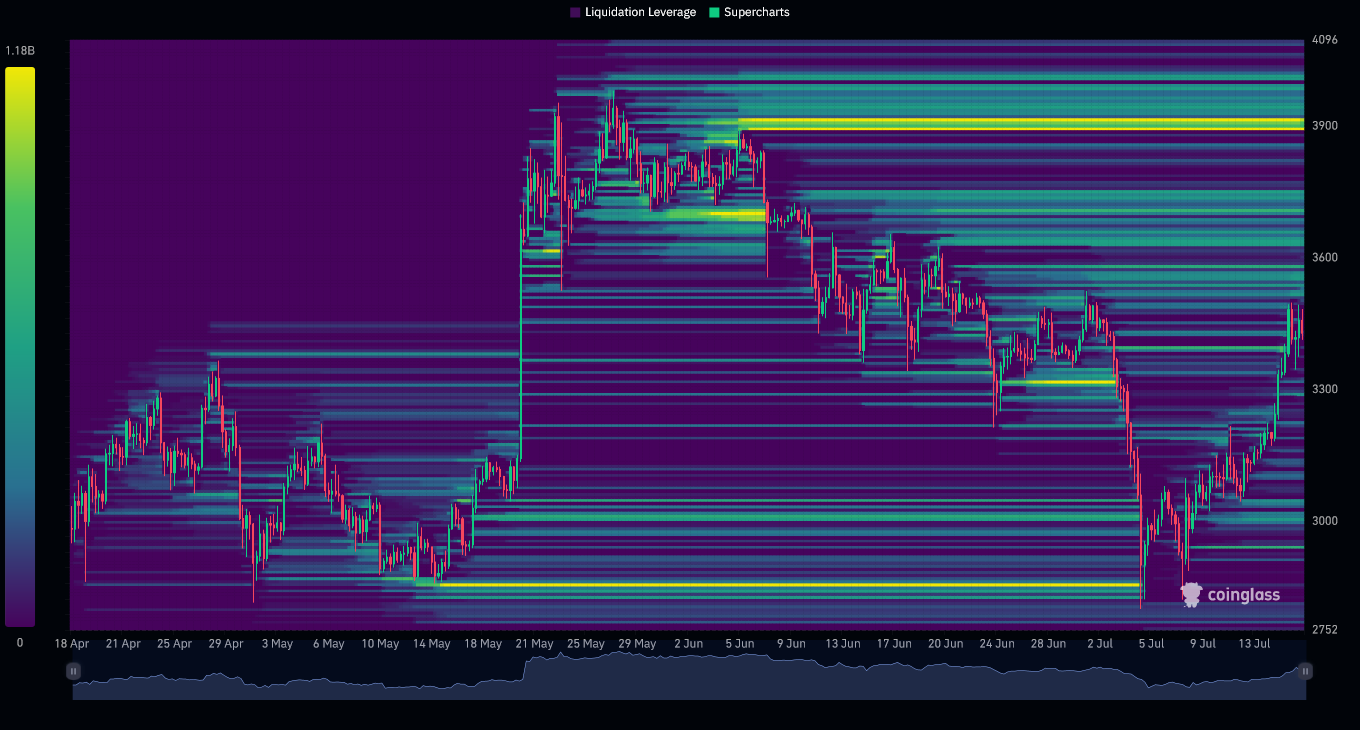
The liquidation heatmap of ETH/USDT over three months reveals that the previously identified liquidation zone at $2,850 has been reached and likely sparked buying interest. Now, the most prominent liquidation zones are mainly above the current price of Ethereum. Notable are the zones between $3,500 and $3,600, and just above, between $3,650 and $3,750. Higher, the most significant zone is at $3,900. Below the current price, $3,000 can still be noted. Approaching these levels could trigger massive orders, increasing the risk of a period of heightened volatility for Ethereum. These zones, therefore, represent crucial points of interest for investors.
Hypotheses for Ethereum (ETH) Price
- If the price of Ethereum stays above $3,065, one could anticipate a continuation of the bullish trend leading to a break above $3,500. The next resistance to consider would then be around $3,700 or even $3,800. If the bullish movement continues, it could reach $4,000 or even $4,100. At this point, this would represent an increase of more than 18%.
- If the price of Ethereum fails to stay above $3,065, one could foresee a return around $2,900. The next support to take into account, if the bearish movement continues, would be around $2,800. Lower, the support at $2,720 can be noted. At this point, this would represent a decrease of about 21%.
Conclusion
After reintegrating the lower part of its range, Ethereum demonstrated a significant rebound. The crypto’s buying interest thus seems to have strengthened, supported by recent announcements and a medium to long-term bullish trend that seems to be continuing. Therefore, optimism seems to dominate regarding the cryptocurrency’s future. However, it will be crucial to closely observe the price reaction to various key levels to confirm or refute current hypotheses. It is also important to remain vigilant against potential “fake outs” and market “squeezes” in each scenario. Lastly, let us remember that these analyses are based solely on technical criteria and that cryptocurrency prices can also change rapidly based on more fundamental factors.
2h ago•
bullish:
0
bearish:
0
Share


 Manage all your crypto, NFT and DeFi from one place
Securely connect the portfolio you’re using to start.

bullish:
0
bearish:
0


