Why Is The Crypto Market Down Today?

0
0

The crypto market slipped 0.75% to $2.57 trillion on April 23 as Bitcoin (BTC) rejected at a critical level while spot demand continued to weaken. Possible capital rotation into US equities added pressure to the move.
Bitcoin fell 0.77% to $77,701 after stalling near $79,474. Among altcoins, Ethena (ENA) dropped over 6% as a developing cup and handle pattern broke deeper into a falling channel amid DeFi stress.
In the news today:-
- BlackRock’s iShares Bitcoin Trust (IBIT) holdings hit a record 806,700 BTC worth $63.7 billion after nine consecutive days of net inflows.
- DeFi total value locked dropped $14 billion in 48 hours after the KelpDAO hack, with Aave alone losing $10 billion in deposits.
- Binance captured 54% of oil perpetual futures volume in a single day, signaling growing demand for always-on exposure to TradFi assets.
Why Is the Crypto Market Down Today?
The total crypto market cap slipped 0.77% to $2.57 trillion on April 23. TOTAL shed $19.45 billion as the recovery from March’s lows ran into resistance. The S&P 500 closed higher on April 22 at 7,114.58, and crypto slipped on the same session. This mirrors a pattern that has held through April where green closes on the S&P coincide with red or flat crypto sessions, consistent with a fund rotation thesis.
Earlier in the week, price pushed higher before rolling over at the 0.786 Fibonacci retracement zone near $2.56 trillion. Meanwhile, a key level at $2.65 trillion now sits as the next major upside barrier.
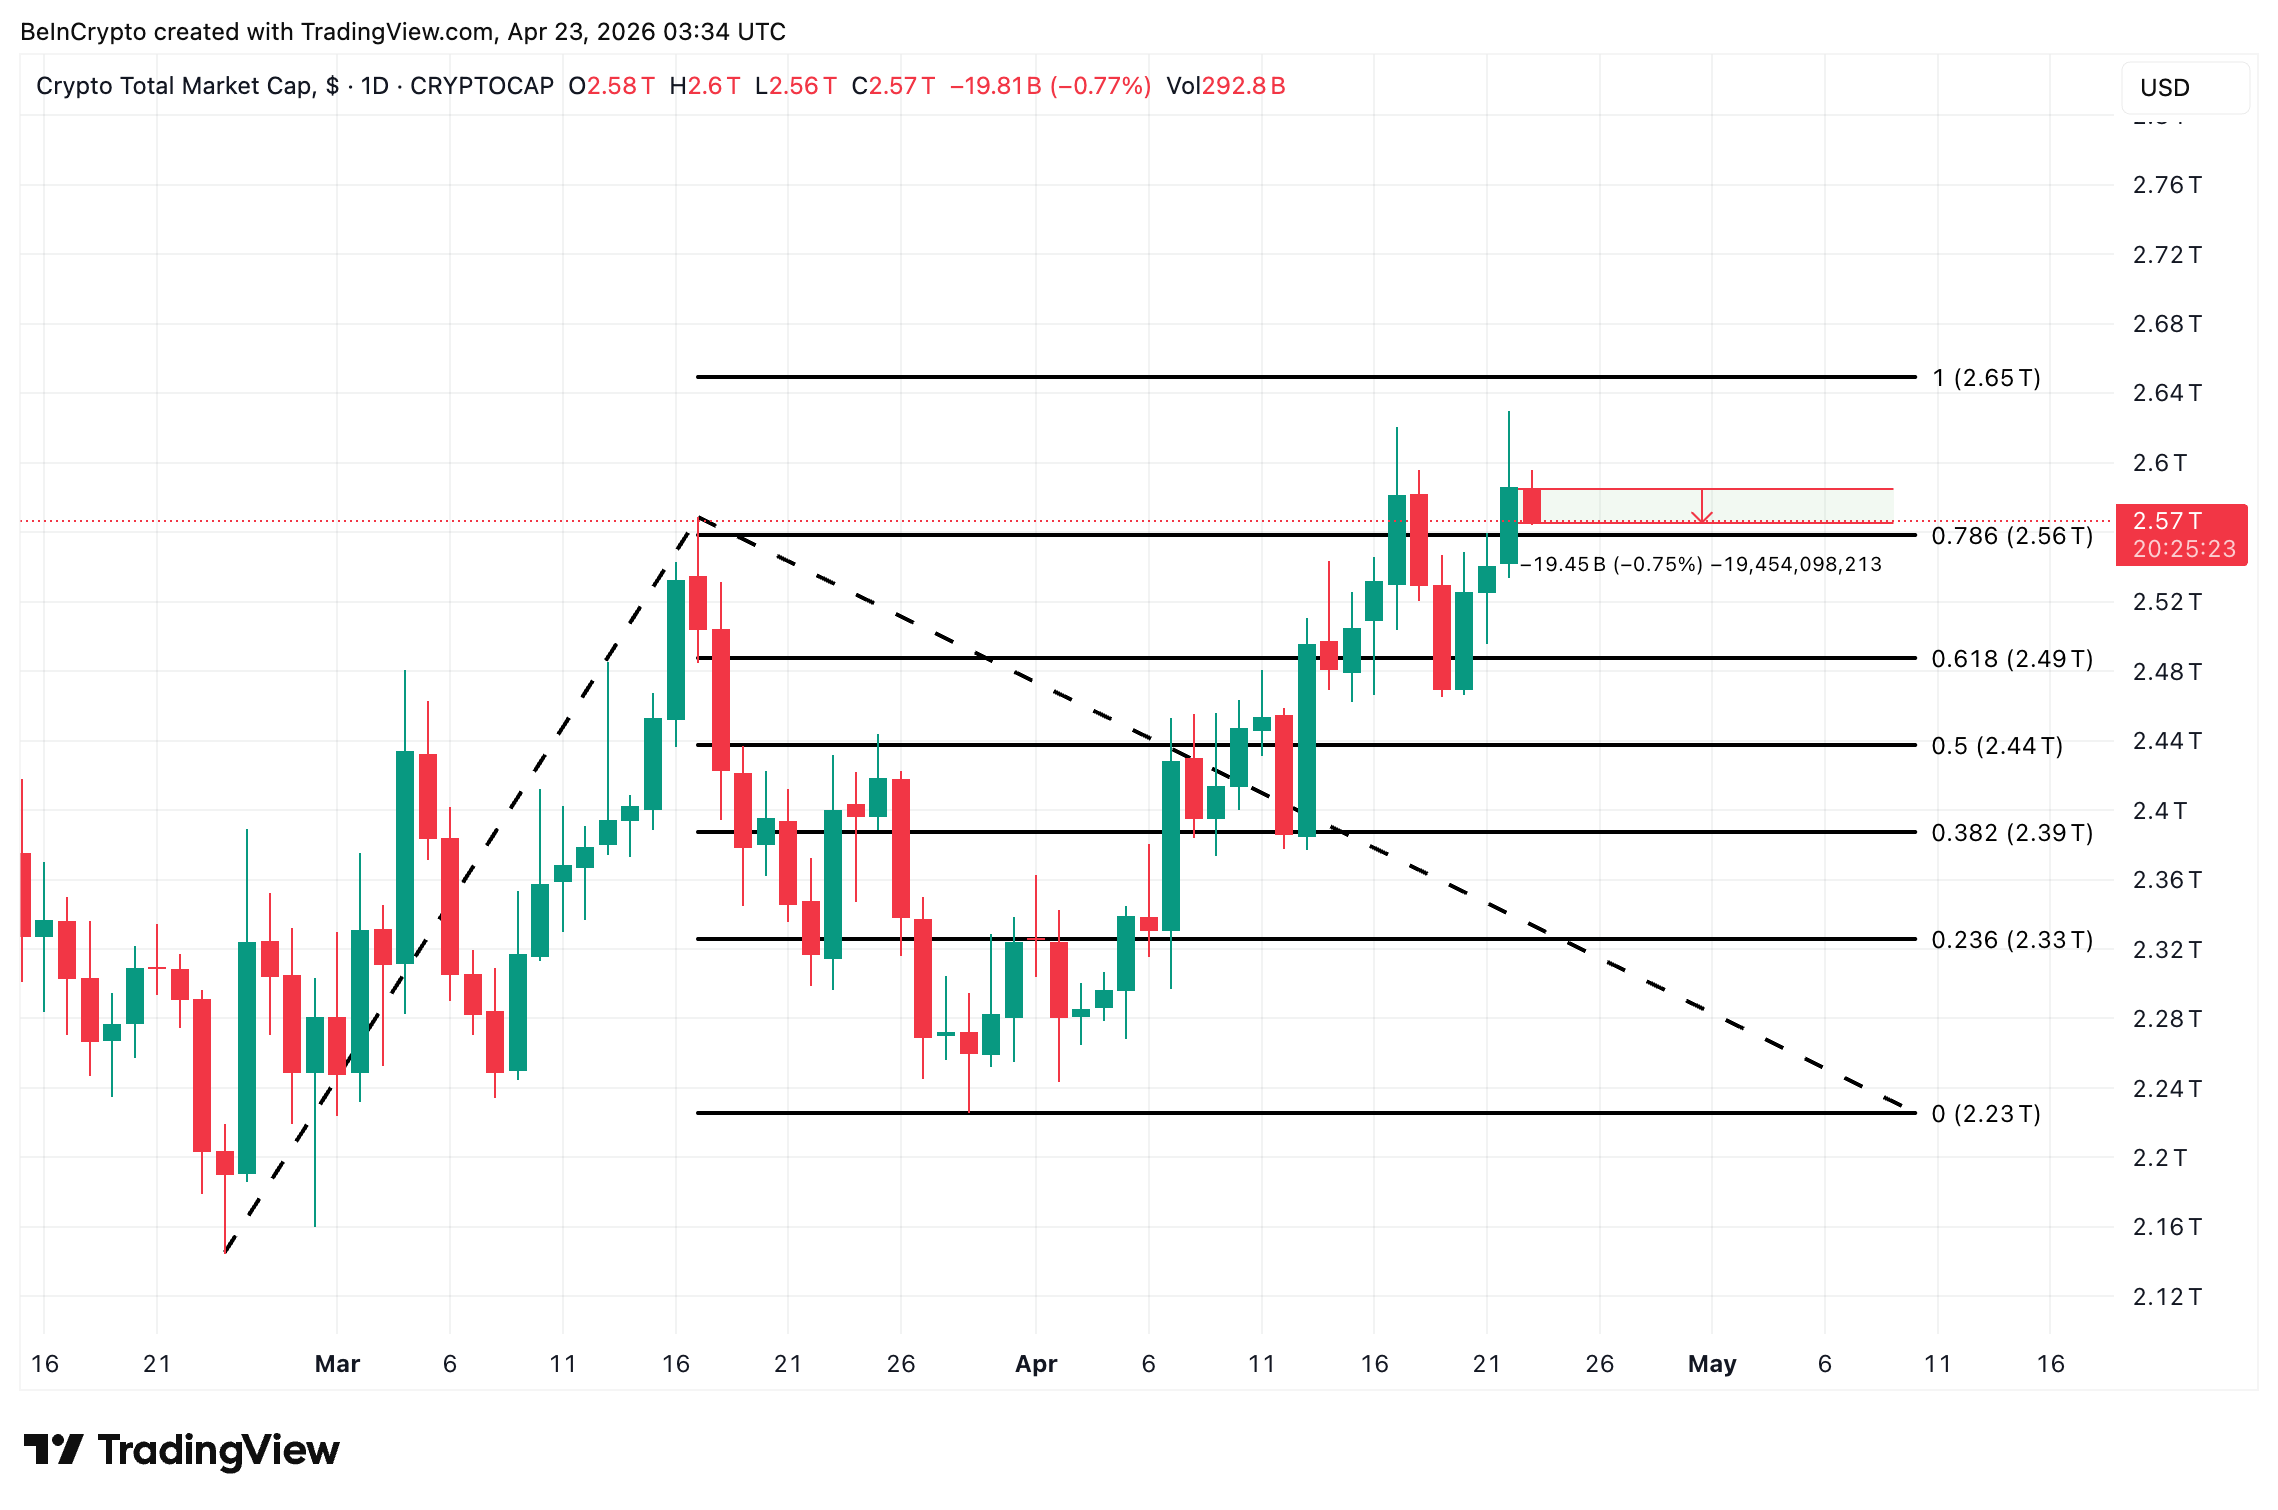 TOTAL Crypto Market Cap Analysis: TradingView
Want more token insights like this? Sign up for Editor Harsh Notariya’s Daily Crypto Newsletter here.
The pullback reflects how thin the recovery has been. While perpetual futures positioning across BTC drove the bounce, spot demand has been contracting. This leaves the market dependent on leverage rather than organic flows. As a result, when leverage-driven rallies run into resistance, pullbacks come quickly.
If $2.56 trillion holds as support, bulls can attempt to break toward $2.65 trillion. However, a daily close below exposes the 0.618 Fib at $2.49 trillion, with the 0.5 Fib at $2.44 trillion as the next downside target.
Bitcoin Price Rejected as Spot Demand Weakens
Bitcoin fell to $77,701 on April 23, slipping after rejecting the $79,474 recovery peak set on April 22. That level marks the top of the bounce from the February low and acted as strong resistance on the first test.
A momentum warning sits underneath the price action. The Relative Strength Index (RSI), a momentum indicator, printed 63.43 on April 22, nearly matching the same reading from the January 5 swing peak. However, price only recovered to $79,474 this time, well short of January’s high. The same momentum producing less upside points to a hidden bearish setup where the rally is structurally weaker than the oscillator suggests.
Underlying flow data confirms the weakness. According to CryptoQuant data shared earlier, the recent bounce has been driven almost entirely by perpetual futures demand. Additionally, the spot demand continues to contract, mirroring the setup that preceded Bitcoin’s January peak at $98,000 before it corrected.
Yet, a daily close above $79,474 opens a path higher.
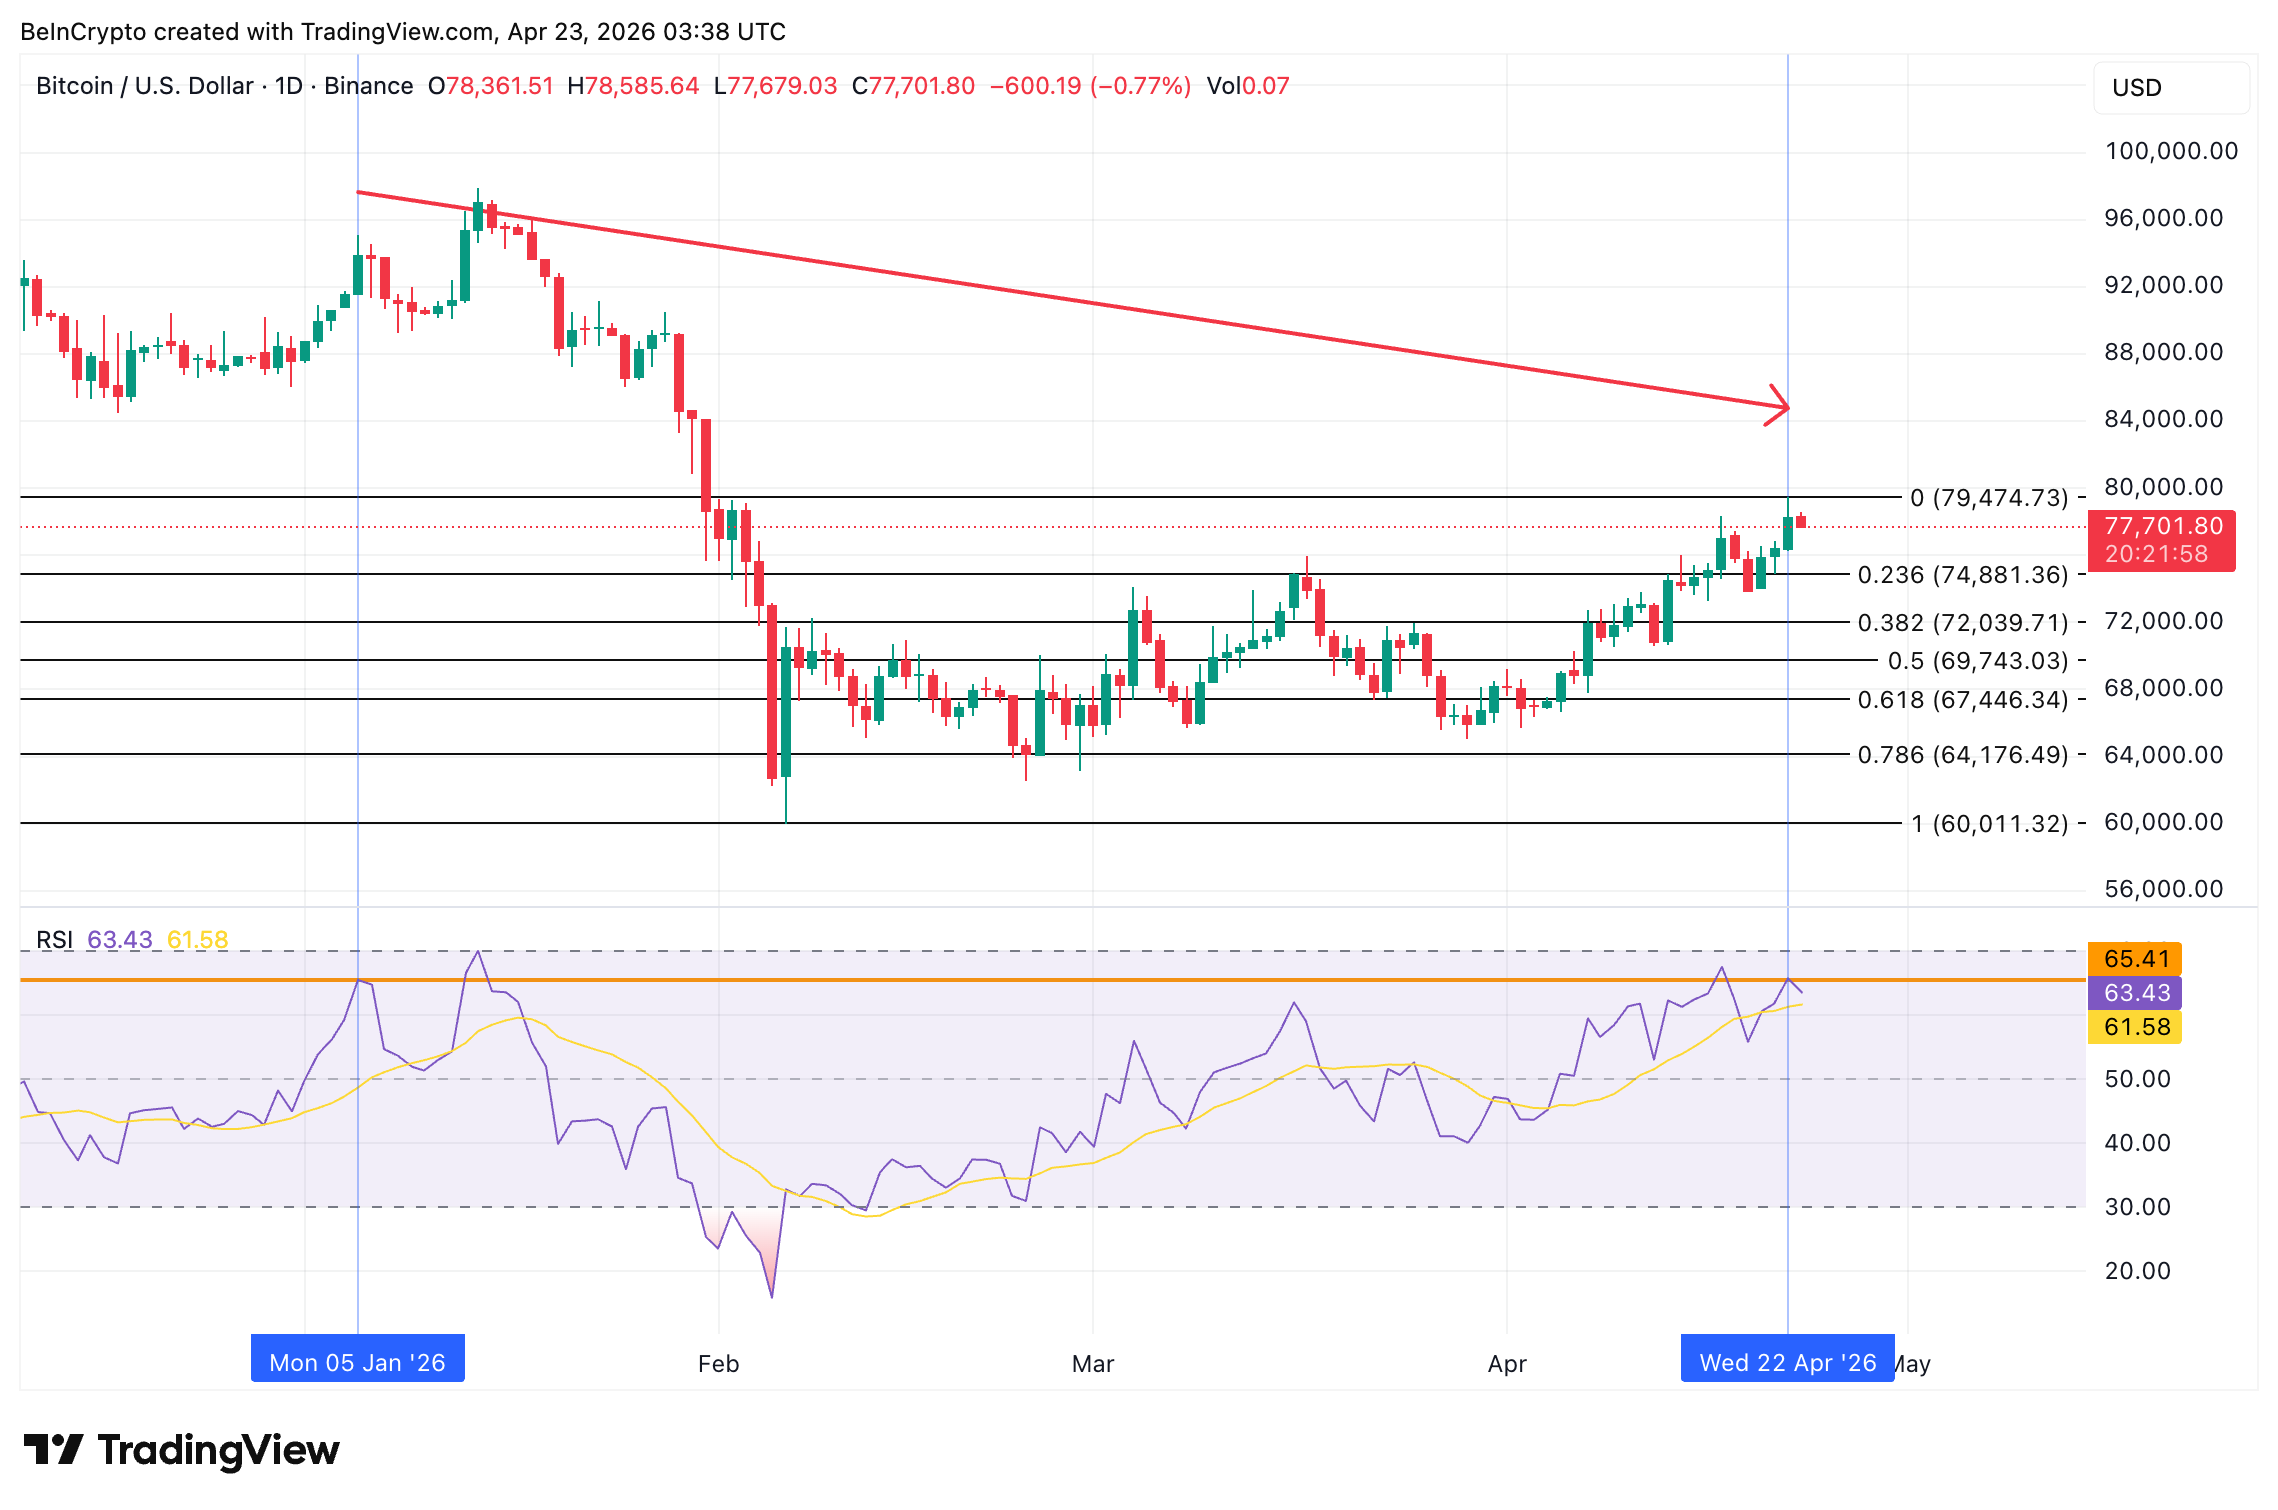 Bitcoin Price Analysis: TradingView
However, a close below the 0.236 Fib at $74,881 exposes the 0.382 Fib at $72,039. The 0.5 Fib level at $69,743 sits as the next major support.
Ethena (ENA) Tests Deep Support as DeFi Stress Builds
Ethena (ENA) dropped over 6% to $0.104, failing to hold the 0.5 Fibonacci level. The bullish cup pattern is still intact even though the handle-pullback has gone beyond the usual comfort level. But there remains a silver lining as the sell-side volume seems to be dropping, hinting at the end of the pullback for ENA.
The breakdown coincided with severe DeFi sector stress. Total value locked across the sector dropped $14 billion, as highlighted earlier, following the KelpDAO hack.
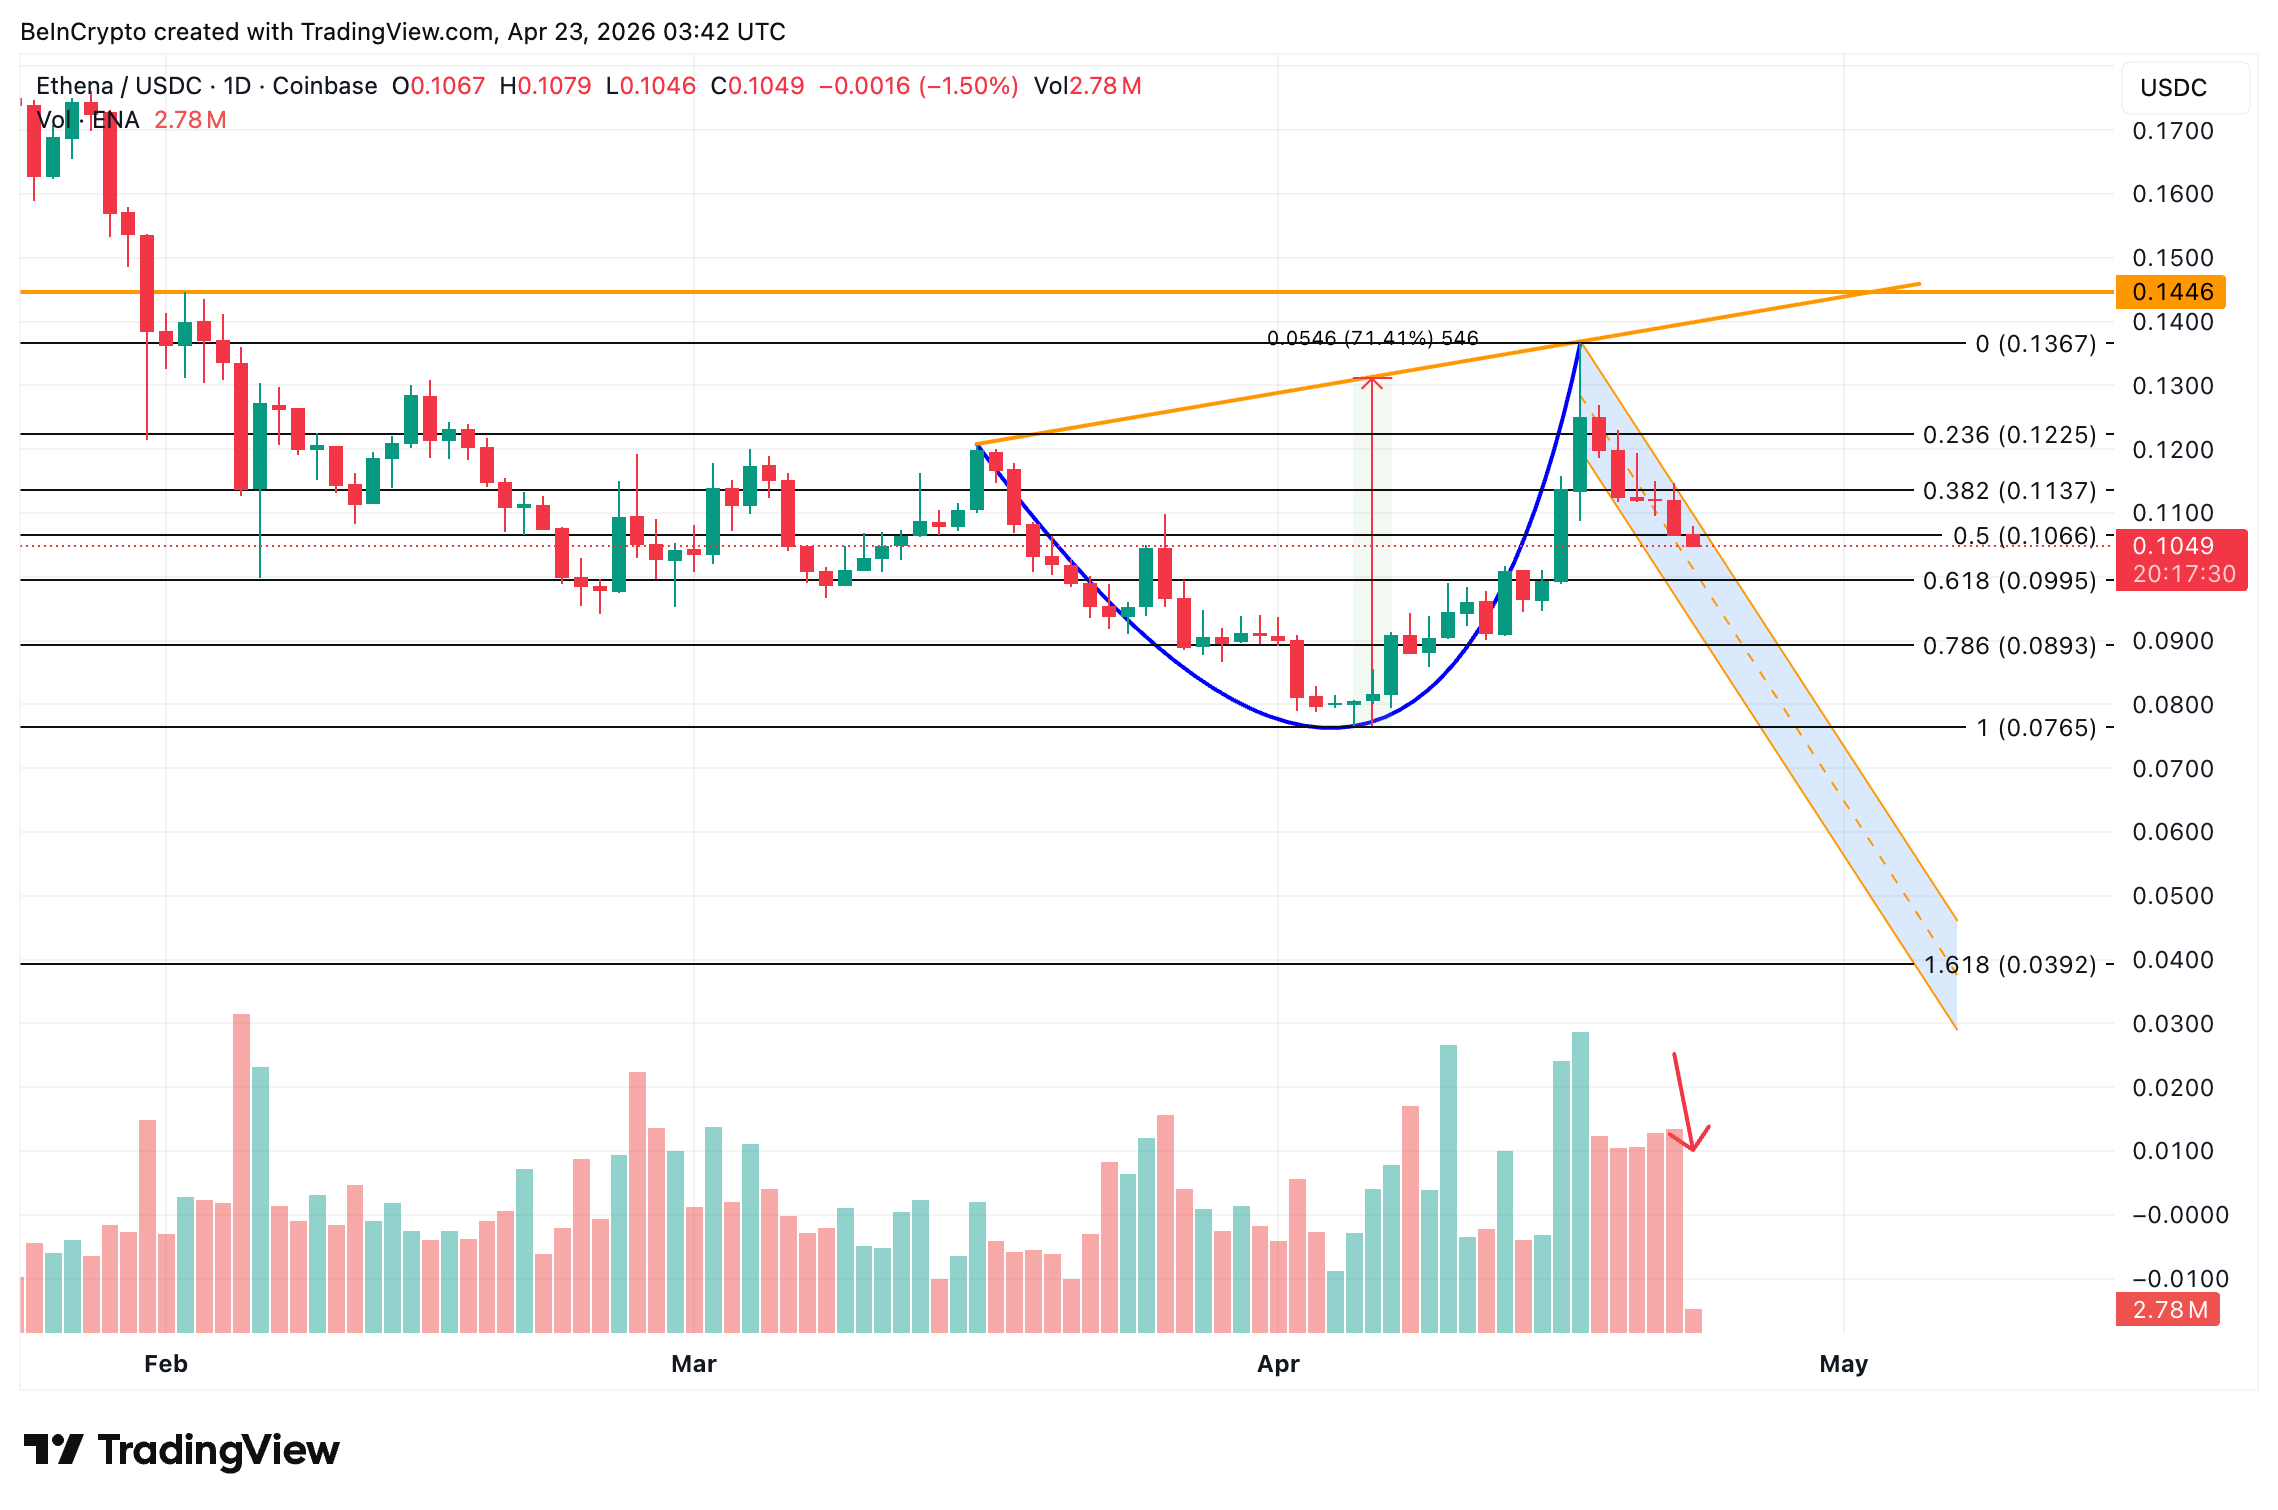 Ethena Price Analysis: TradingView
The immediate direction hinges on the 0.5 Fib or $0.106. Reclaiming this level followed by $0.122 confirms a handle breakout for ENA. Crossing above $0.144 would confirm a pattern breakout, possibly activating the 70% breakout projection. However, a drop under $0.099 would weaken the bullish outlook.
The $0.099 level separates a potential relief bounce toward $0.113 from a deeper slide to the $0.076 base.
0
0


 Manage all your crypto, NFT and DeFi from one place
Securely connect the portfolio you’re using to start.

0
0


0
0

0
0