What Happens to Stellar (XLM) Price in August After 68% Monthly Rally?

0
0
Stellar’s native cryptocurrency XLM XLM $0.40 24h volatility: 3.0% Market cap: $12.29 B Vol. 24h: $566.05 M ended July 31 with a strong 68% upside, becoming the 12th largest crypto asset with a market cap of $12.16 billion. XLM also outperformed top players like BTC BTC $115 520 24h volatility: 2.1% Market cap: $2.29 T Vol. 24h: $59.69 B , ETH ETH $3 641 24h volatility: 3.6% Market cap: $439.14 B Vol. 24h: $40.37 B , during the strong rally last month.
However, following the rejection at $0.50, XLM price has come under some selling pressure. Historically, August has been a bearish month for the Stellar cryptocurrency.
Stellar (xlm) price faces selling pressure as august begins
Stellar’s native cryptocurrency XLM is down by 8% in the last 24 hours, dropping to $0.38 as of now. In the last two weeks, XLM price is already down by 14% indicating consistent selling pressure.
Looking at XLM’s historical pattern, XLM investors need to maintain caution during the month of August. August has historically been a weak month for crypto, closing in the green only twice, in 2017 and 2021, while posting losses in all other years.
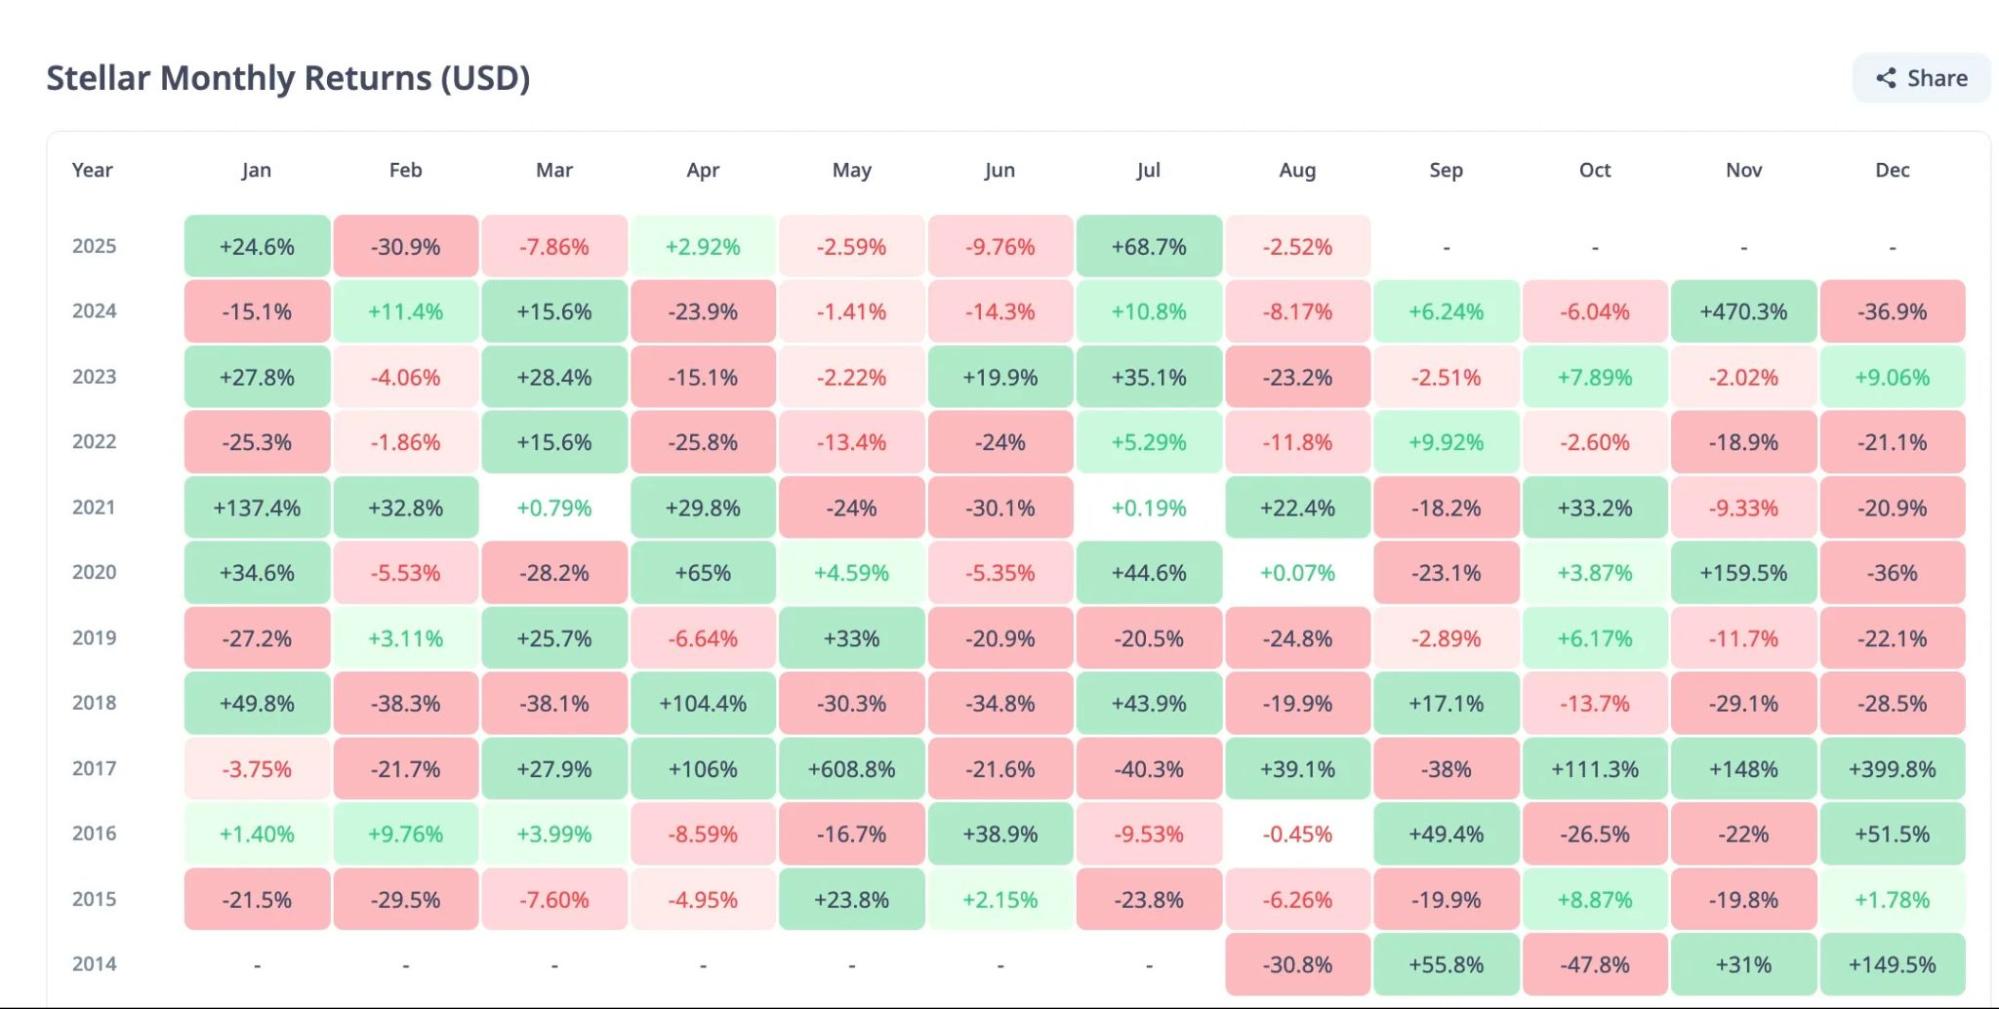
Stellar (XLM) Price Drop in August | Source: CryptoRank
The start of August coincides with weak technical indicators for XLM. This sets the stage for further downside from here.
XLM’s one-day chart shows that the recent double-digit decline has pulled the token’s price below its 20-day Exponential Moving Average (EMA), which now acts as dynamic resistance around $0.40. A break below this level typically signals a shift in short-term market sentiment from bullish to bearish.
Stellar Price Loses 20 EMA | Source: Tradingview
Bear and bull case scenarios for xlm
With weakening demand and its historically poor August performance, XLM price can drop further from the current levels of $0.39. Thus, it would continue on its path of a broader short-term downtrend.
Both price momentum and capital flow indicators are showing bearish signals, reflecting growing negative sentiment. If capital inflows continue to decline, XLM could slip to $0.36. A break below this support level may extend the decline further, potentially pushing the XLM price down to $0.32.
However, if the buyer demand recovers, the Stellar crypto could stage an upside from here. A sustained increase in accumulation could lift XLM back above its 20-day EMA. If the breakout is maintained, the token may retest the $0.41 level, potentially signaling a short-term bullish reversal.
Stellar $XLM appears to be forming a bullish flag, hinting at a potential breakout toward $0.80! pic.twitter.com/OwPEakdzuu
— Ali (@ali_charts) July 31, 2025
Popular crypto analyst Ali Martinez floated the possibility of a flag-and-pole pattern breakout ahead. If this breakout happens, XLM price could see the next stop at $0.80.
The post What Happens to Stellar (XLM) Price in August After 68% Monthly Rally? appeared first on Coinspeaker.
0
0

 Manage all your crypto, NFT and DeFi from one place
Securely connect the portfolio you’re using to start.


0
0


0
0