Dogecoin Price Today: RSI at 22, Fear at 12 — Bounce or Breakdown?

0
0
Trading at $0.07 on June 29, 2026, the Dogecoin price today reflects sustained selling pressure. The Fear & Greed Index has collapsed to 12, firmly in Extreme Fear territory. DOGE now sits at a critical decision point between a rebound and further decline.
Key takeaways
- DOGE trades at $0.07 with the Fear & Greed Index at 12, signaling Extreme Fear.
- Daily RSI has dropped to 22.52, deep in oversold territory beneath all key moving averages.
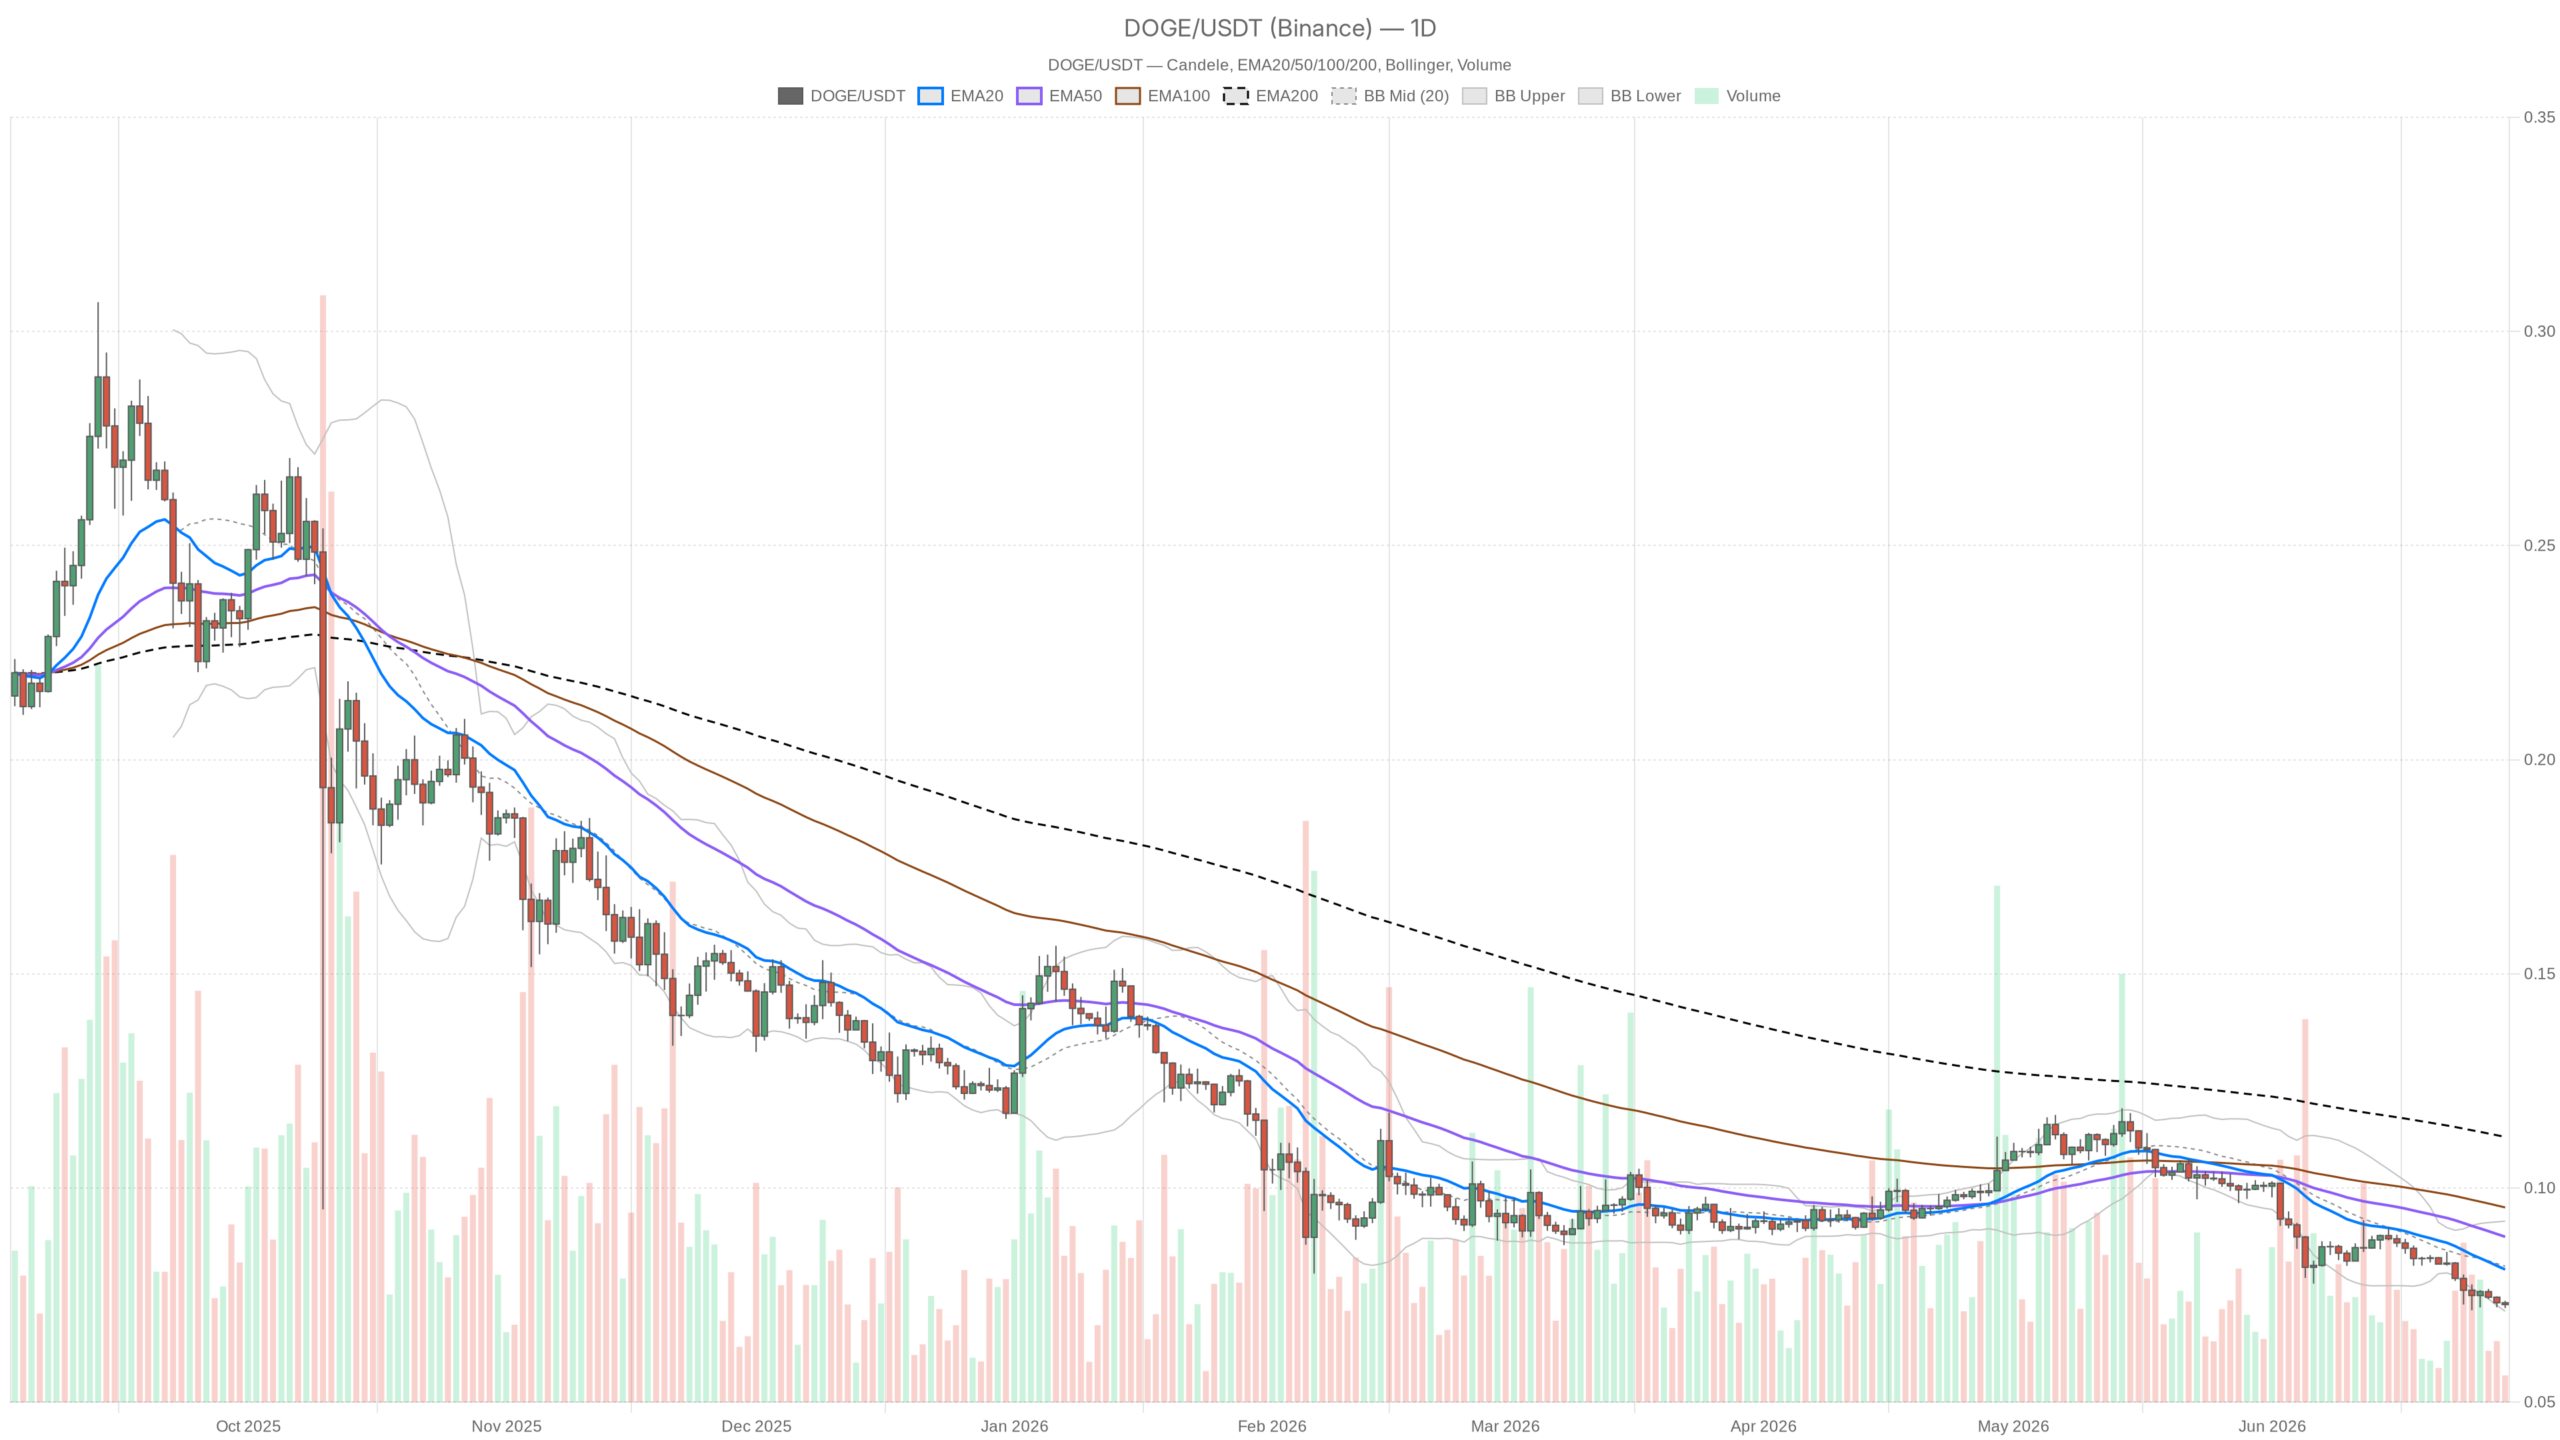
- The 20-day, 50-day, and 200-day EMAs form a bearish stack at $0.08, $0.09, and $0.11 respectively.
- Pivot levels across timeframes are compressed at $0.07, signaling an imminent volatility expansion.
- Bitcoin dominance above 55.75% reflects capital consolidating into BTC rather than risk assets like DOGE.
Adding a layer of macro complexity, internal SEC emails recently published by Bloomberg have surfaced concerns about DOGE’s growing reach, referencing Elon Musk’s Department of Government Efficiency initiative. The broader crypto market cap sits at approximately $2.15 trillion with Bitcoin dominance above 55.75% — a reading that typically reflects capital consolidating into BTC rather than risk assets like DOGE.
The Daily Chart Is Screaming Oversold — But Oversold Can Stay Oversold
The daily chart confirms a clean bearish structure with DOGE trading well beneath all key moving averages. Oversold conditions alone do not guarantee a reversal. The close at $0.07 sits beneath the 20-day EMA at $0.08, the 50-day at $0.09, and the 200-day at $0.11. This is a textbook bearish stack. Sellers have been in control for a sustained period, and the moving averages now act as a cascading ceiling rather than dynamic support.
The daily RSI at 22.52 is deep in oversold terrain — well beneath the conventional 30 threshold. Historically, readings this low in DOGE have preceded violent short-covering rallies. However, RSI can remain depressed for extended periods during genuine downtrends. Without a momentum shift on the MACD to confirm any reversal, an oversold RSI alone is a poor entry signal. The MACD line sits at -0.01, slightly below a flat signal line, with the histogram essentially at zero. There is no bullish crossover forming and no divergence worth trading. The momentum engine is stalled, not turning.
The Bollinger Bands on the daily offer an interesting data point: price is currently hugging the lower band at $0.07, with the midline at $0.08 and the upper band at $0.09. When price rides the lower band in a downtrend without any bounce toward the midline, it typically signals that selling pressure is consistent rather than panicked and exhausted. Still, a reversion toward the $0.08 midline would be the minimum expectation for any meaningful relief rally. Even that would just be a retracement within the bearish regime, not a trend change.
The Hourly and 15-Minute Frames Add Nothing Bullish
Short-term timeframes offer no bullish signals. Price, all EMAs — the 20, 50, and 200-hour — and Bollinger Bands are all compressed around $0.07. The 1H RSI at 42.6 is neutral-to-soft, not oversold. This means the short-term flush that typically precedes a bounce has not happened at this granularity. The 200-hour EMA at $0.08 stands as the most meaningful near-term resistance level. Until DOGE can close above that on an hourly basis with conviction, any intraday move is likely to fade.
The 15-minute frame, useful only for execution timing, mirrors this compression. RSI at 46.39 and a flat MACD confirm there is no emerging micro-momentum. For anyone already positioned, this timeframe would only matter for fine-tuning entries on a potential bounce setup. There is no setup to speak of yet.
Pivot Levels and What They Mean in This Environment
Extreme pivot compression at $0.07 across all timeframes signals a market primed for a breakout — but the direction remains unresolved. The pivot point, R1 resistance, and S1 support are all converging at the same level. This reflects a market in a very tight range with almost no recent volatility to work with. It is a classic sign of a squeeze that can break in either direction. The absence of meaningful ATR, effectively near zero in the data, confirms that realized volatility has dried up. These conditions often precede an expansion move. However, the direction remains unclear until a catalyst or a volume spike tips the balance.
The Bullish Case
A recovery requires a daily close above the $0.08 20-day EMA with RSI reclaiming 30 and a positive MACD histogram — conditions that have not yet materialized. If those triggers fire, the first real target becomes the Bollinger midline at $0.08, with a stretch toward the 50-day EMA at $0.09 representing a fuller recovery. The extreme fear sentiment means short interest is likely elevated, so a genuine reversal could move faster than most expect. That said, the bullish case gets invalidated immediately if any attempted recovery stalls below $0.08 and rolls over. That would simply confirm the overhead supply is too thick to breach.
The Bearish Case
The bearish scenario does not require much imagination given the current structure. If DOGE loses its footing at $0.07 — the confluence of pivot support, lower Bollinger Band, and recent lows — there is limited technical structure visible beneath it. The next psychological level of note would be the $0.05–$0.06 range, though the compressed pivot data does not give clean downside targets. The bearish thesis is invalidated only by a strong multi-day reclaim of the EMA stack, beginning with the 20-day at $0.08.
Positioning Through the Uncertainty
For anyone tracking the Dogecoin price today, this chart describes a market in genuine distress — not necessarily one about to collapse further, but one that has not yet shown the technical evidence required to justify directional confidence. The combination of extreme fear sentiment, deep daily oversold conditions, and flat intraday momentum creates a paradox. The setup looks tempting for contrarian buyers on a pure RSI basis. Yet the absence of any momentum confirmation and the cloud of macro headline risk makes premature positioning genuinely dangerous.
Volatility is currently compressed, which historically means it will not stay that way. Traders watching DOGE right now should focus less on price and more on the conditions that would signal a change. Specifically, a volume-backed daily close above $0.08 on the upside, or a decisive break and daily close below $0.07 on the downside. Until one of those triggers fires, this is a market to observe rather than trade aggressively. The risk of being early in either direction at these compressed levels is real, and capital preservation matters more than catching the first move.
FAQ
What is Dogecoin’s price today?
As of June 29, 2026, Dogecoin is trading at $0.07, with the Fear & Greed Index at 12 in Extreme Fear territory and the daily RSI deep in oversold conditions at 22.52.
Why is Dogecoin in Extreme Fear territory?
The Fear & Greed Index has collapsed to 12 due to sustained selling pressure, a bearish EMA stack across all major timeframes, and broader macro uncertainty — including internal SEC emails raising concerns about DOGE’s growing reach. Bitcoin dominance above 55.75% further reflects capital rotating away from risk assets.
Can Dogecoin recover from $0.07?
A recovery is possible but requires specific technical triggers: a daily close above the $0.08 20-day EMA, an RSI reclaim above 30, and a positive MACD histogram. Until these conditions align, the bearish structure remains intact, and oversold conditions alone do not guarantee a bounce.
What are the key levels to watch for DOGE right now?
The critical levels are $0.08 on the upside — aligned with the 20-day EMA and Bollinger midline — and $0.07 on the downside, where pivot support, the lower Bollinger Band, and recent lows converge. A break of either level with volume would likely determine the next directional move.
Disclaimer: This article is for informational purposes only and does not constitute financial advice, an investment recommendation, or a solicitation to buy or sell any financial instrument or cryptocurrency. The analysis provided is not indicative of future results. Investing in crypto assets and financial markets carries a high risk of capital loss. Always do your own research (DYOR) and consult a qualified financial advisor before making any decision.
Article produced with the assistance of artificial intelligence and reviewed by the editorial team.
0
0


 Manage all your crypto, NFT and DeFi from one place
Securely connect the portfolio you’re using to start.

0
0


0
0
