Ethereum Classic Hints A Bearish Pattern! ETC Price To Drop 10% Soon?
27d ago•

bullish:
1
bearish:
0
Share

The post Ethereum Classic Hints A Bearish Pattern! ETC Price To Drop 10% Soon? appeared first on Coinpedia Fintech News
The crypto industry has displayed a strong bullish trend after trading under a bearish influence for a period. Moreover, the ETC price has recorded a jump of approximately 13% in valuation within the past 24 hours, following which it faced correction in the chart.
The Ethereum Classic price had started the month of March on a bullish note by adding significant valuation to its portfolio within the first week. After recording a high of $39, the bulls lost momentum and displayed a sideways trend for about a week, indicating a cool-off in the price action.
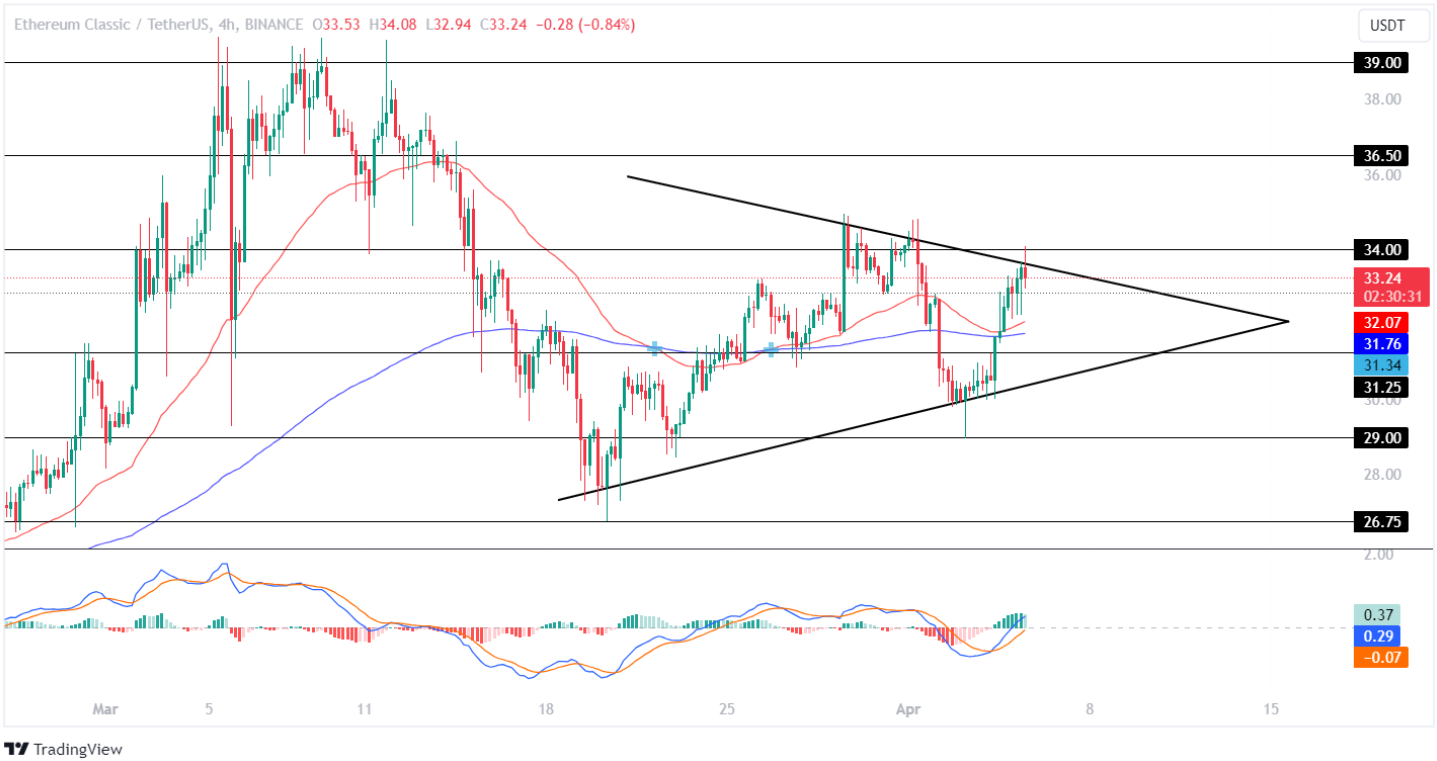
As the volatility in the market grew, the bulls lost momentum and started trading under a bearish influence. The Ethereum Classic price recorded a correction of approximately 30%, following which the bulls regained momentum and displayed a positive price action.
However, the bulls faced correction after surpassing the resistance level of $34 on 29th March. This resulted in the altcoin forming a symmetric triangle pattern. Since then, the price has been constantly trading in the pattern, indicating a long-term bearish influence in the crypto market for this altcoin.
The technical indicator, MACD, displays a decline in the green histogram, highlighting a decrease in the buying sentiment in the crypto market. Further, the averages show a constant rise, suggesting a mixed sentiment in the crypto space.
Will Ethereum Classic Go High?
If the market pushes its price above the resistance level at $34, it will successfully break out of the symmetric triangle and start trading under a bullish influence. Maintaining the price at that level will set the stage for the ETC price to attempt to test its upper resistance level of $36.50.
Negatively, if a trend reversal occurs, the bulls will lose momentum and fall to test its lower support level of $31.25 during the upcoming week.
27d ago•
bullish:
1
bearish:
0
Share


 Manage all your crypto, NFT and DeFi from one place
Securely connect the portfolio you’re using to start.

bullish:
0
bearish:
0

bullish:
0
bearish:
0

bullish:
1
bearish:
0

bullish:
1
bearish:
0