
Bonk Price Prediction: Will BONK Leave SHIB and DOGE Behind?

0
0

BONK landed in late 2022 as Solana's answer to the meme coin frenzy happening everywhere else, airdropped to the community right as the chain was climbing back from a rough patch.
It worked better than anyone expected, honestly. Solana needed a spark, and BONK became one of the loudest ones.
Fast forward to now, and this Bonk price prediction looks at where BONK actually sits today, trading around $0.00000280, and whether the current setup favors buyers or sellers from here.
Bonk Price Prediction: Live Market Data
BONK is currently trading at $0.00000280, down 0.8%.
Market cap sits at $246.508M, and since BONK's full supply of 87.995T is already circulating, fully diluted valuation lands at the exact same figure.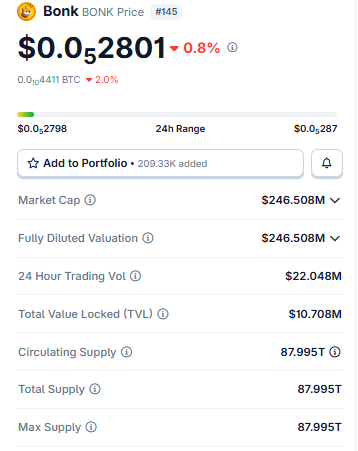
Source: $Bonk Market Cap Data Taken From Coingecko, data as of Aug 04, 2026. Figures may vary slightly across other tracking websites.
No future dilution to worry about here. Daily volume of $22.048M keeps the market active, and total value locked near $10.708M shows there's genuine ecosystem activity beyond pure speculation.
On-Chain and Market Drivers
The liquidation heatmap for BONK is practically silent right now.
Every timeframe checked, the 1-hour, 4-hour, 12-hour, and 24-hour windows all show the exact same $22.58 in liquidations, entirely on the long side, with zero shorts touched. 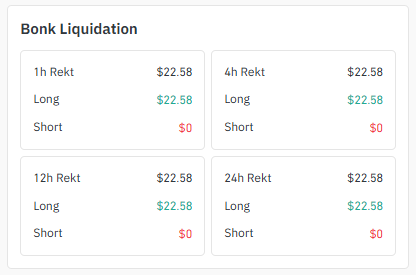
Source: Liquidation Data Taken From Coinglass.
That flat repetition across every window means one small long position got liquidated a while back and nothing has changed since. No cascade, no squeeze, just a quiet market waiting for its next real move.
Exchange volume is led by OKX at $3.34M, well ahead of the rest of the field. Bitunix follows at $1.03M, then LBank at $875.21K, WhiteBIT at $544.13K, and Gate at $462.64K. 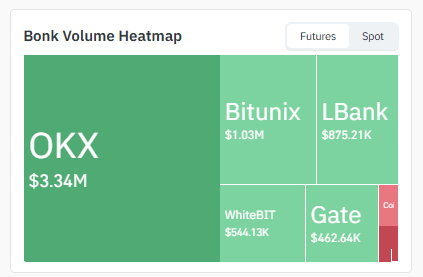
Source: Volume Heatmap Data Taken From Coinglass.
This spread across multiple venues suggests reasonably healthy liquidity, though concentrated enough on OKX that a large move there could ripple across the broader market.
Key Takeaways
-
BONK is trading at $0.00000280, stuck inside a descending channel on the 4-hour chart.
-
Clear the channel's upper boundary with volume and price, which could run toward $0.00000309.
-
On the daily chart, a demand zone near $0.00000270 has been absorbing sell pressure for weeks.
-
Lose that demand zone and BONK risks a drop toward the 1.618 Fibonacci extension at $0.00000223.
-
Liquidations have been almost nonexistent, just $22.58 total, entirely on the long side.
Technical Analysis of $BONK
4-Hour Chart Analysis
BONK is boxed inside a clearly marked descending channel on the 4-hour chart, bouncing between a falling upper boundary and a falling lower boundary for weeks now. 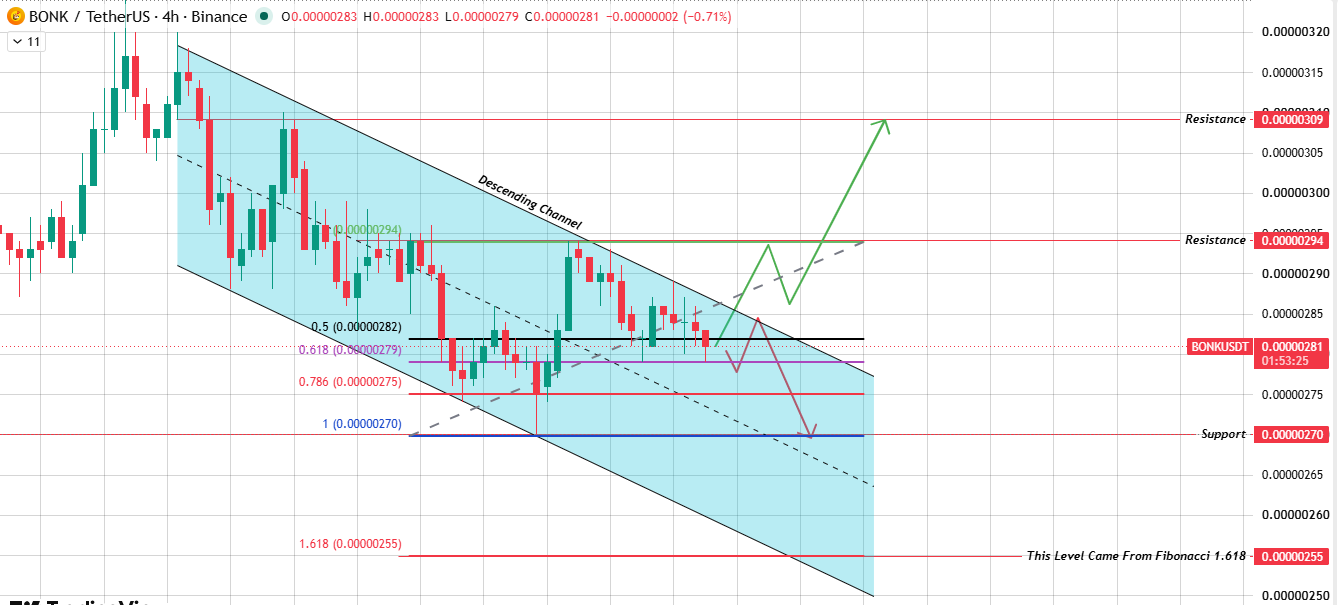
Source: Chart Taken From TradingView.
Break above the upper boundary with volume behind it, and price should push toward the resistance level at $0.00000294 first, then $0.00000309 if momentum carries through.
But if $BONK can't hold above that upper boundary, expect it to drift back down to the lower boundary and potentially break through it, opening a path toward the support at $0.00000270, with the Fibonacci 1.618 extension at $0.00000255 sitting below that as the next stop.
1-Day Chart Analysis
Zooming out to the daily , a descending trendline is capping every bounce, while a wide demand zone sits underneath price, roughly between $0.00000270 and current levels. 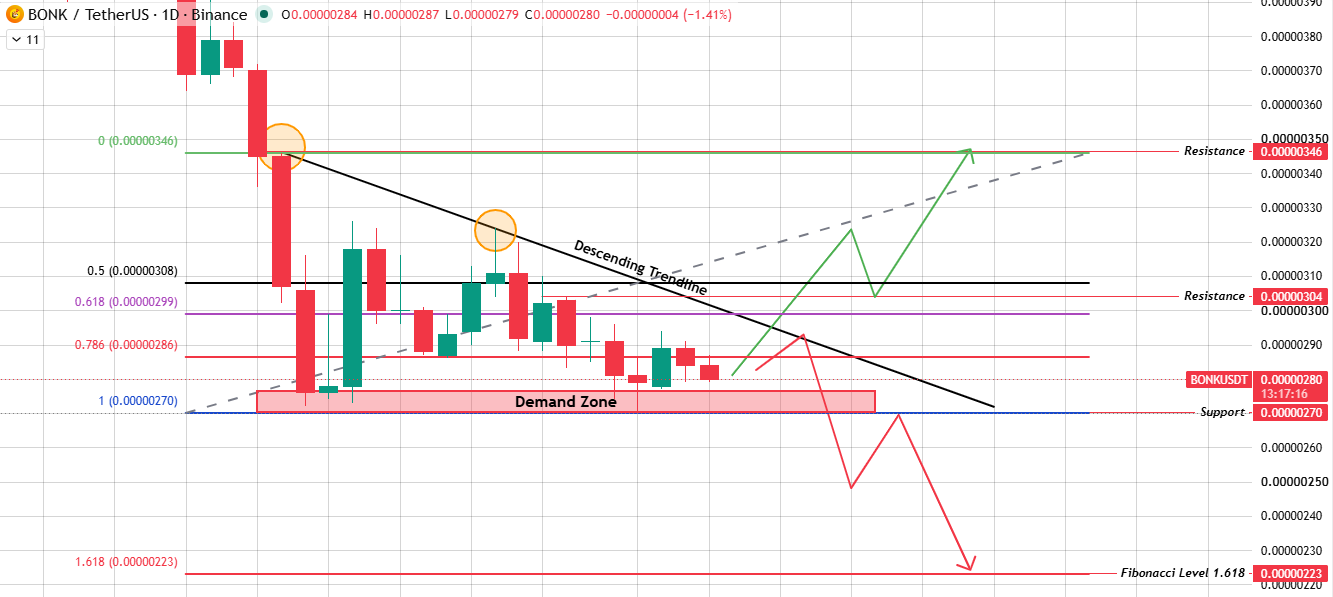
Source: Chart Taken From TradingView.
That zone has been absorbing sell pressure for a while now.
If the price pushes back above the demand zone with volume and clears the trendline.
$BONK likely runs toward the resistance level at $0.00000304, with $0.00000346 as the stretch target beyond that.
If the demand zone fails to hold instead, and sellers push through it, the drop could extend all the way to the Fibonacci 1.618 extension near $0.00000223.
Bull, Base, and Bear Case
What kills the bull case? A rejection right at the descending trendline again. What kills the bear case? Buyers stepping back into the demand zone with real size.
Catalysts to Watch
The demand zone holding or failing is the real story behind this Bonk price prediction right now.
Solana ecosystem activity tends to matter more for BONK than most catalysts, since the token's fortunes are still closely tied to overall network usage and sentiment.
Beyond that, BONK's price target often moves alongside BTC dominance shifts; a falling dominance chart usually gives Solana meme coins more room to run.
ETH correlation matters less here given BONK lives entirely on Solana, but broader crypto risk appetite still sets the tone regardless.
Watch for volume the moment the price tests either the channel boundary or the demand zone.
Analyst Forecasts
Much of the current BONK conversation centers on whether the demand zone holds, rather than any single bullish or bearish call from a specific analyst.
The zone has already absorbed multiple selling attempts without breaking, which technically favors buyers so far, but it hasn't been tested with heavy volume yet either.
The quiet liquidation data adds another layer to this picture.
With almost nothing forced out in either direction recently, whatever move comes next likely reflects genuine positioning rather than leverage getting flushed out of the market.
Long-Term Outlook
Stepping back, $BONK remains well below its earlier cycle highs, and its long-term path is still tightly linked to Solana's broader health as a chain. That's both an opportunity and a risk.
Strong Solana activity tends to lift $BONK alongside it, but weakness there drags BONK down regardless of $BONK-specific technicals.
A sustained hold above the demand zone, paired with a break of the daily descending trendline, would be the clearest long-term bullish signal available right now.
Until that happens, BONK likely keeps trading as a reflection of Solana sentiment more than anything unique to itself.
Glossary
Descending Channel: Two parallel lines both sloping downward, boxing the price between a falling upper boundary and a falling lower one until it breaks free either way.
Descending Trendline: A single line connecting a series of lower highs, sloping down, that price either respects or eventually breaks through.
Demand Zone: A price range where buyers have repeatedly stepped in before, absorbing sell pressure and propping the price back up.
Support level / Resistance Level: Chart areas where buying or selling has shown up with enough force in the past to pause or reverse a move.
BTC Dominance: Bitcoin's share of the entire crypto market cap, a quick way to gauge whether altcoins and meme coins have room to run.
Methodology: price levels sourced directly from 4H and 1D TradingView charts; liquidation and volume data sourced from Coinglass; no data extrapolated beyond visible chart structure.
Disclaimer: This article is for informational purposes only and does not constitute financial advice. Cryptocurrency markets, including BONK, are highly volatile and speculative. Price levels discussed are derived from technical chart analysis of TradingView data as of August 4, 2026, and are probability-based scenarios, not guarantees. Always conduct independent research and consult a licensed financial advisor before making investment decisions.
0
0


 Manage all your crypto, NFT and DeFi from one place
Securely connect the portfolio you’re using to start.


0
0

0
0
