
Hyperliquid Price Prediction: HYPE Nears A Massive Breakout

0
0
HYPE just entered one of the tightest technical squeezes it has seen in weeks, and the way the next few candles close could decide which direction this token is headed next.
Price is coiled up inside a pattern that traders watch closely because of how sharply it tends to resolve once it breaks, and right now, HYPE is sitting right in the middle of that decision zone.
This Hyperliquid price prediction breaks down exactly what has to happen for bulls to take control, what flips the setup bearish, and why the difference between a wick and a confirmed close could matter more than usual this time.
What Is Hyperliquid and $HYPE
Hyperliquid is a Layer 1 blockchain built specifically for on-chain perpetual futures trading, positioning it as a decentralized alternative to centralized derivatives platforms.
HYPE is the network's native token, used for governance and fee-related mechanics, and it also trades as a perpetual contract itself on platforms including Binance, which is where the chart data in this HYPE technical analysis comes from.
Because HYPE sits at the intersection of a live derivatives market and its own token economics, both trading data and burn or supply data are relevant to any Hyperliquid coin price prediction.
$HYPE Market Snapshot
Metric | Value |
Price | $56.186 |
24h Change | -6.21% (-$3.7177) |
Market Cap | $14.16B |
Fully Diluted Valuation (est.) | ~$53.5B |
Futures Volume (24h) | $2.19B |
Spot Volume (24h) | $122.06M |
Open Interest | $2.38B |
Circulating Supply | 252.63M HYPE (about 26.5% of max supply) |
Total / Max Supply | 953.01M HYPE |
Data captured from CoinGlass HYPE market data on July 28, 2026, around 9:30 AM IST.
Prices and volumes move quickly, so recheck this snapshot close to publish time rather than relying on it hours later.
Supply context: Circulating supply is only about a quarter of HYPE's 953.01M total and max supply, which is why fully diluted valuation (roughly $53.5B at current price) sits well above the $14.16B market cap.
There is no separate unlock schedule figure available in the data reviewed for this article; if HYPE has a public vesting calendar, it is worth checking the project's own documentation before treating the FDV gap as a near-term selling risk.
Latest $HYPE News: Ongoing Token Burns
Hyperliquid's fee-funded burn mechanism remains active.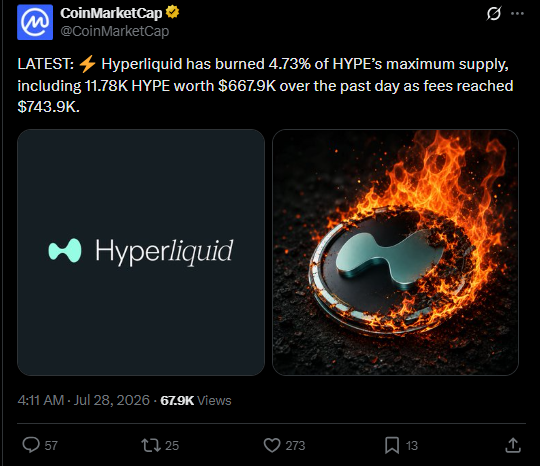
As per a CoinMarketCap update citing on-chain data, the network has burned 4.73% of HYPE's maximum supply to date, including 11.78K HYPE worth about $667.9K burned in the prior 24 hours against roughly $743.9K in protocol fees over the same window.
This figure is sourced secondhand through CoinMarketCap's post rather than a primary Hyperliquid on-chain dashboard, so treat the exact burn total as directional rather than final until cross-checked against Hyperliquid's own explorer or fee dashboard
$HYPE Spot ETF Flow Trend
Three consecutive tracked sessions of net outflows have pulled cumulative net inflow down from $299.62M to $289.83M, with total net assets falling from $294.15M to $279.22M over the same stretch. 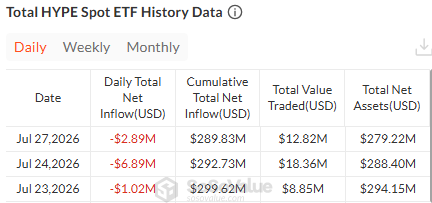
HYPE spot ETF products are a relatively new category, and listing status, structure, and regulatory recognition can vary by jurisdiction and provider, so this flow data should be checked against the issuing product's own disclosures rather than treated as a universally recognized regulatory filing.
$HYPE Liquidation Data
Timeframe | Total Liquidated | Long Liquidations | Short Liquidations |
1 hour | $528.57 | $528.57 | $0 |
4-hour | $2.61M | $2.61M | $7.01K |
12-hour | $9.91M | $9.88M | $24.39K |
24-hour | $11.86M | $11.43M | $427.32K |
Source: CoinGlass HYPE liquidation tracker, captured July 28, 2026, around 9:30 AM IST. 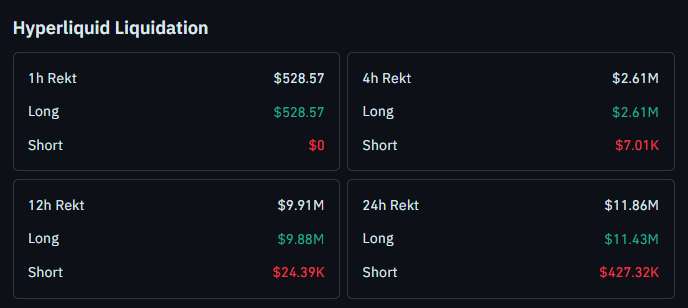
Over the past 24 hours, long positions have absorbed the overwhelming majority of forced closures, more than 96 percent of total liquidated value, which is consistent with the sharp pullback that preceded the current wedge.
This kind of lopsided flush often removes overextended long positions before a market resolves in either direction, so it is a useful companion to the technical picture below rather than a standalone signal.
Multi-Timeframe Technical Snapshot
Indicator | Reading |
Primary timeframe used | 4-hour |
Pattern | Falling wedge, price currently inside it |
Open interest | $2.38B against $2.19B in 24h futures volume, an OI-to-volume ratio above 1, suggesting positioning is building faster than fresh volume is turning over |
Wedge resistance trendline | Roughly $60.4 |
Wedge support trendline | Roughly $55.5 |
Recent range (visible on chart, prior two weeks) | Roughly mid-$54s to mid-$64s |
A quick note on two terms used above: Open interest (OI) is the total value of derivative positions still open and unsettled, and it rising while volume stays flat can mean traders are holding positions rather than actively trading them, which sometimes precedes a sharper move once the wedge resolves.
Quick Take
Bullish trigger: close above $60.426, opening the door toward $63.454 and $69.062
Bearish trigger: close below $55.484, opening the door toward $54.015 and $52.634
Invalidation for the wedge thesis: a clean close outside the $55.484 to $60.426 range in either direction
These levels come from the 4-hour timeframe. If HYPE closes well beyond this range on a higher timeframe like the daily chart, these zones should be rechecked before acting on them.
Hyperliquid price forecast : Technical analysis
HYPE's 4-hour chart shows price compressed inside a falling wedge, a pattern built from two downward-sloping trendlines that converge over time.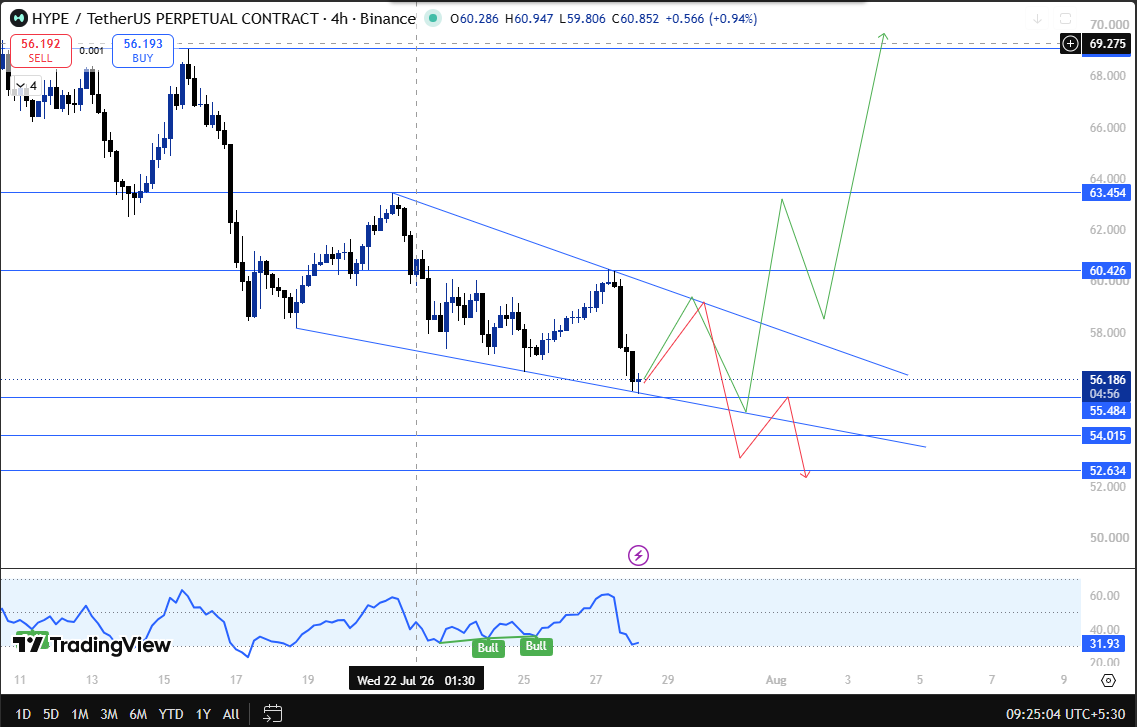
Wedges of this type are generally read as continuation and reversal setups that tend to resolve toward the upside once price closes convincingly above the upper boundary, though that outcome is a tendency, not a guarantee.
The distinction that matters most here is between a wick and a close.
A wick is a brief intra-candle spike that gets rejected before the candle finishes, while a close is the price the market actually settles at once that 4-hour candle finishes printing.
A close above $60.426 or below $55.484 reflects sustained control by one side; a wick through either level does not, and treating a wick as confirmation is one of the more common ways this kind of setup produces a false signal.
For that reason, this HYPE support and resistance framework should be read on confirmed closes, not intrabar prints.
From the current price of $56.186, the math on each scenario looks like this:
Close above $60.426: about 7.6% above current price, opening room to $63.454 (about 13% above) and $69.062 (about 23% above)
Close below $55.484: about 1.2% below current price, opening room to $54.015 (about 3.8% below) and $52.634 (about 6.3% below)
Zoomed out, the chart shows HYPE has ranged roughly between the mid-$54s and mid-$64s over the past two-plus weeks, which puts the current wedge squarely inside that broader band rather than at a fresh extreme.
That context matters for this Hyperliquid breakout analysis because it suggests the wedge is more of a mid-range pause than a make-or-break test of a multi-month level.
Glossary
Falling wedge: A pattern formed by two converging, downward-sloping trendlines, commonly read as a continuation setup that tends to resolve upward on a confirmed close above the upper boundary.
Open interest (OI): The total value of derivative contracts still open and unsettled at a given time, distinct from trading volume.
Liquidation: The forced closure of a leveraged position once losses erode available margin below the required maintenance level.
Fully diluted valuation (FDV): Token price multiplied by max supply, showing total theoretical valuation if all tokens were in circulation, as opposed to market cap, which uses only circulating supply.
Token burn: The permanent removal of tokens from circulating supply, in HYPE's case funded by a share of protocol fees.
Confirmed close: The settled price at the end of a candle's timeframe, used to validate breakouts or breakdowns rather than relying on an intrabar wick.
HYPE Support and Resistance Levels
Level | Price | Distance from CMP | Note |
Resistance 2 | $69.062 | +23.0% | Extended upside target if breakout continuation holds |
Resistance 1 | $63.454 | +13.0% | First target after a confirmed wedge breakout |
Breakout trigger | $60.426 | +7.6% | Requires a confirmed 4h close, not a wick |
Current price | $56.186 | — | Trading inside the wedge |
Breakdown trigger | $55.484 | -1.2% | Requires a confirmed 4h close, not a wick |
Support 1 | $54.015 | -3.8% | First support on a confirmed breakdown |
Support 2 | $52.634 | -6.3% | Extended downside target |
Risk-Reward Table
Scenario | Entry Reference | Target Zone | Stop Reference | Approximate Risk-Reward |
Bullish (breakout) | Confirmed close above $60.426 | $63.454 to $69.062 | Below $58.000 | Roughly 1:3 |
Bearish (breakdown) | Confirmed close below $55.484 | $54.015 to $52.634 | Above $57.500 | Roughly 1:2.5 |
A note for leveraged traders: these ratios assume the trigger levels hold as described and do not account for slippage, funding costs, or gaps around news events.
Leveraged positions in either direction carry the risk of liquidation before a level is confirmed, as the liquidation data above shows has already happened to a meaningful number of longs in just the past 24 hours.
This is technical structure, not a recommendation to enter a position.
Invalidation: the wedge thesis breaks down if HYPE closes back inside the $55.484 to $60.426 range shortly after a breakout or breakdown close, which typically signals a false move rather than a genuine trend shift.
Why This Zone Matters More Than a Typical Pause
Two things separate this setup from an ordinary intraday consolidation.
First, the OI-to-volume ratio above 1 suggests positioning has been building without a proportional rise in trading activity, which tends to compress volatility until a close forces a resolution.
Second, the burn-adjusted supply backdrop, with roughly 4.73% of max supply already permanently removed and fee-funded burns continuing daily,
means the token's effective circulating growth is slower than raw emissions would suggest, a structural factor that sits underneath the shorter-term wedge pattern rather than replacing it.
Short-Term Setup vs. the Broader Trend
This is a short-term, 4-hour timeframe read. It says nothing definitive about HYPE's multi-week or multi-month trend on its own.
If the price closes well outside the $55.484 to $60.426 range on a higher timeframe such as the daily chart, these specific levels should be rechecked rather than relied on as-is.
Expert View
The CoinGabbar research desk reads the current wedge as a compression pattern rather than a directional call in itself.
The heavy skew toward long liquidations over the past 24 hours has likely cleared out some overleveraged positioning, which can set up a cleaner move once a close actually confirms a direction.
At the same time, the fading ETF inflow trend points to somewhat cooler institutional demand in the very short term, which is one reason a confirmed close above $60.426 would carry more weight as a signal than a quick wick through that level.
Until that close happens, HYPE, broadly ranging between about $55.5 and $60.4, remains the more balanced read of the current data.
Sources and Methodology
HYPE market data: CoinGlass, captured July 28, 2026, ~9:30 AM IST
HYPE liquidation data: CoinGlass liquidation tracker, captured July 28, 2026, ~9:30 AM IST
Burn and fee data: CoinMarketCap post citing on-chain figures, posted 4:11 AM IST, July 28, 2026
Technical levels: original 4-hour TradingView chart analysis of the HYPE/USDT perpetual contract
Related coverage: HYPE breakout zone analysis, HYPE decision range setup, HYPE decision zone breakdown, HYPE pennant breakout pattern, Hyperliquid price prediction today updates
All figures above should be rechecked immediately before publishing, since price, open interest, liquidation, and ETF flow data can shift materially within a few hours.
Disclaimer : This article is for informational purposes only and does not constitute financial advice. HYPE and other cryptocurrencies are highly volatile, and leveraged trading carries a risk of significant or total loss. Please verify current data independently and consult a licensed financial advisor before making any investment decisions.
0
0

 Manage all your crypto, NFT and DeFi from one place
Securely connect the portfolio you’re using to start.


0
0

0
0

0
0