
Pepe Price Prediction: Wolfe Wave Signals Big $0.000005 Breakout Soon?

0
0

Pepe price prediction searches are rising as the meme coin reaches a decisive point on the 4-hour chart.
This Pepe price prediction looks at the chart, the Wolfe wave projection, and holder distribution to map the next likely move.
$PEPE is trading near $0.000004268, up 1.4% on the day. Market cap sits around $1.795 billion, which keeps it at #58 by market cap.
The Pepe price today shows a market that is pressing against resistance and waiting for a clear direction.
Live $PEPE Market Data
Metric | Value |
Price | $0.00000426 |
24H Change | +1.4% |
24H Range | $0.00000417 - $0.00000438 |
Market Cap | $1.795B |
24H Trading Volume | $278.301M |
Perps 24H Open Interest | $739.223M |
Source: market data taken from CoinMarketCap, as of Sep 30, 2026. Figures may vary slightly across other tracking websites.
The circulating supply already equals the max supply at 420.69T, so no new $PEPE will be issued. Holders do not have to worry about inflation from new tokens.
Pepe Coin News Today: Derivatives and Volume
The latest Pepe coin news today comes from the derivatives market. Perpetual futures open interest stands at $739.223 million, which is high compared with the $278.301 million traded in spot and derivatives volume over 24 hours.
That means a lot of leveraged positions are open around this price. When open interest is this large, a breakout above resistance or a breakdown below support can move price faster than usual.
Traders should watch volume closely. A breakout backed by rising volume is more reliable than one that happens on thin trading.
PEPE Holder Distribution
Holder data shows how concentrated the supply is. The top 100 wallets control 76.86% of the supply, and whale wallets hold 89.99% of the market cap while making up just 0.11% of all holders.
The top 5 holders own 27.95%, and the top 10 own 36.99%. The Gini score sits at 0.9938, which points to very high concentration. There are 20 holders who own at least 1% of the total supply.
Tier | Holders | % of Holders | % of Market Cap |
Whale | 656 | 0.11% | 89.99% |
Shark | 3,211 | 0.54% | 4.83% |
Dolphin | 21,072 | 3.56% | 3.41% |
Fish | 78,162 | 13.21% | 1.39% |
Crab | 161,659 | 27.31% | 0.34% |
Shrimp | 327,143 | 55.27% | 0.04% |
Source: Holder data taken from Etherscan, as of Sep 30, 2026.
The wallet depth data shows 161 wallets holding more than $1 million in $PEPE and 656 wallets holding more than $100,000.
High concentration cuts both ways. A few large wallets can push the price when they buy and just as easily when they sell.
Some of these large wallets may also belong to exchanges or treasuries, so traders usually treat the number as a risk indicator, not as pure whale buying or selling.
Pepe Coin Technical Analysis
This Pepe coin technical analysis starts with the structure on the 4-hour chart.
On the 4-hour chart, $PEPE is trading inside a descending channel, a pattern made of two falling parallel trendlines. 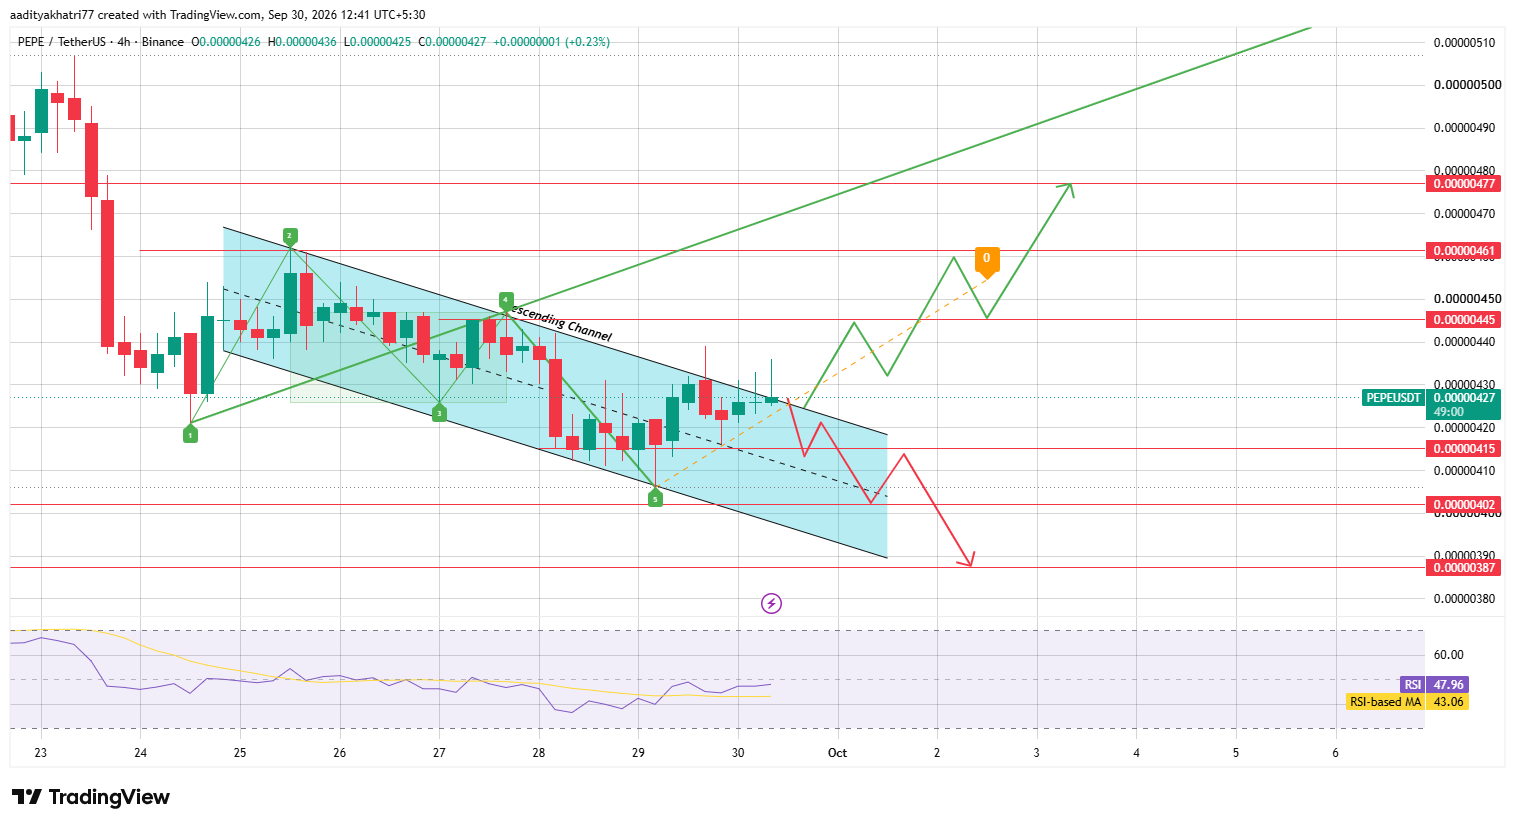
Source: Chart taken from TradingView, as of Sep 30, 2026
Price was rejected from the upper boundary and bounced from the lower boundary several times, and it is now trading around $0.00000427, close to the top of the channel.
The Wolfe wave indicator has also marked its five-point structure on the chart. After the fifth point formed near the lower channel line, the price bounced and moved back toward the upper boundary.
That is the setup a Wolfe wave trader looks for, because the pattern projects a move toward the line drawn from points 1 to 4.
RSI reads 47.96, above its moving average of 43.06. Momentum is improving, but RSI is still below the 50 midline, so buyers need a strong push to take full control.
Can $PEPE Break Out Toward $0.000005?
The bullish setup begins with a breakout. If $PEPE breaks above the upper boundary of the descending channel and holds, the first resistance to clear is $0.00000445.
A close above $0.00000445 opens the path toward $0.00000461. If buyers keep control and volume supports the move, the next level to watch is $0.00000477.
The Wolfe wave projection points even higher. The projected line extends toward the $0.000005 zone, which is where the bullish target from this pattern sits.
A breakout without volume can easily fail and send the price back into the channel. That is why a strong candle close above the boundary matters more than a wick above it.
What Happens If $PEPE Gets Rejected?
The bearish setup works in steps too. If $PEPE is rejected from the upper boundary of the channel, the first support to watch is $0.00000415.
A break below $0.00000415 exposes $0.00000402. If sellers stay in control, the next major support is $0.00000387, near the lower part of the channel.
A rejection would also cancel the Wolfe wave breakout idea for now. Once support breaks, the move can be fast, because traders who bought near resistance may start to exit together.
Pepe Price Levels to Watch
Support | Resistance |
$0.00000415 | $0.00000445 |
$0.00000402 | $0.00000461 |
$0.00000387 | $0.00000477 |
Bull, Base, and Bear Scenarios
Scenario | Setup | Level |
Bull | Channel breakout and Wolfe wave projection with volume | $0.00000445 to $0.000005 |
Base | Price stays inside the channel, range trade | $0.00000415 to $0.00000445 |
Bear | Rejection from resistance and support break | $0.00000402 to $0.00000387 |
Pepe vs Bitcoin
Bitcoin's direction usually sets the tone for meme coins like $PEPE. A risk-on market helps breakouts hold above resistance, while a risk-off move can pull PEPE's support levels lower no matter what the chart says.
On the pairs, PEPE is up 2.5% against Bitcoin over the last 24 hours, which shows it is slightly outperforming the market leader right now.
Methodology
This Pepe price prediction October 2026 was built from a 4-hour PEPEUSDT chart sourced through Binance via TradingView.
The descending channel boundaries, Wolfe wave points, RSI, and RSI-based moving average were checked candle by candle.
Support and resistance levels came directly from the marked price zones on that chart.
Live price, market cap, volume, open interest, and supply figures came from a market data snapshot, while holder data came from a separate snapshot taken the same day.
Nothing here substitutes for independent research. A chart pattern only describes probability, not certainty.
Expert Opinion
Based on the chart and market data, the setup leans cautiously constructive while $PEPE holds above $0.00000415 and presses against the channel top.
The Wolfe wave structure and RSI trading above its moving average support a possible breakout.
At the same time, RSI below 50, heavy whale concentration, and large open interest mean a rejection can be sharp.
A breakout only matters if $PEPE closes above the channel and $0.00000445 with volume behind it.
Disclaimer: This article is for informational purposes only and does not constitute financial advice. Cryptocurrency markets, including Pepe, carry high volatility and downside risk; prices can move sharply against any projected level, and past performance offers no guarantee of future results. Readers should conduct independent research before making any investment decision.
0
0

 Manage all your crypto, NFT and DeFi from one place
Securely connect the portfolio you’re using to start.


