
Cardano Price Prediction: ADA Eyes $0.51 After Polymarket Boost

0
0

Cardano price prediction chatter is picking up again as ADA holders watch one particular line on the chart that has quietly been doing all the work for months.
Something has been building underneath the surface on the daily timeframe, the kind of setup that tends to go unnoticed until it suddenly does not.
Buyers have shown up at exactly the right moments, and the way price has behaved on its recent tests suggests the market is not done deciding where ADA goes next. Here is the full picture
Cardano Price Today: Live ADA Data and 24-Hour Change
Cardano is trading at $0.2106 at the time of this snapshot, down 6.15% on the day, with the token shedding about $0.0138 in the last 24 hours.
Futures volume across exchanges sits at $605.03 million against spot volume of $142.99 million, showing that derivatives traders are currently driving most of the short-term price action in ADA.
Open interest is holding at $453.58 million, which tells us leveraged positioning has not unwound despite the pullback.
Cardano's market cap stands at $7.73 billion, with a circulating supply of 36.73 billion ADA out of a total supply of 44.99 billion and a hard max supply of 45 billion coins.
Source: CoinGlass, Cardano market data, accessed September 5, 2026.
Cardano News: Polymarket Adds ADA to Its Perpetuals Lineup
Cardano just picked up another distribution channel in the derivatives space.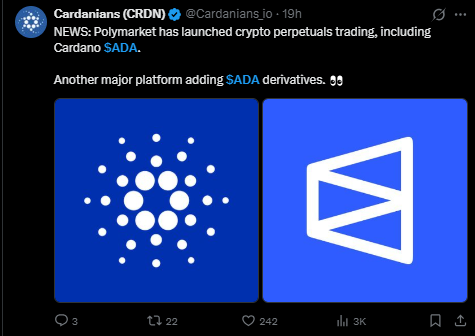
Polymarket has rolled out crypto perpetual trading and included Cardano's ADA among the assets available at launch, a move that puts ADA alongside other majors on a platform better known for prediction markets branching into perpetual futures.
For a coin whose futures volume already dwarfs its spot volume, another venue offering $ADA derivatives adds to the pool of leveraged interest that traders will be watching closely, especially with price sitting near a key technical decision point.
Source: Cardanians (@Cardanians_io) on X, posted roughly 19 hours before this snapshot, September 5, 2026.
Cardano Technical Forecast: ADA Price Prediction and Breakout Levels
Zooming into the daily chart, $ADA has been climbing while resting on an ascending trendline that has held since the middle of this year.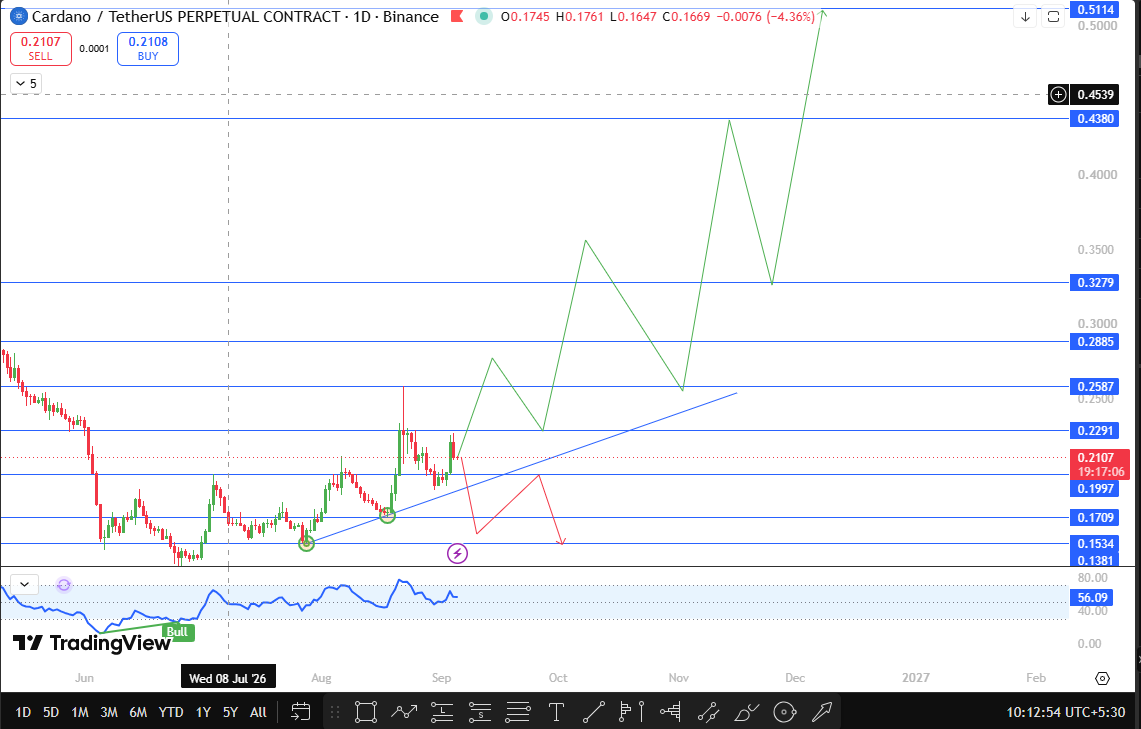
What stands out is how price behaved on its first real test of that trendline: instead of a weak bounce, buyers stepped in aggressively, pushing price to a fresh higher high rather than just defending the line.
That kind of reaction, a sharp push rather than a shallow retest, is usually a sign that demand underneath the market is stronger than the recent daily red candle suggests.
Right now Price is holding above that trendline but has pulled back into a zone where the next daily close will matter a lot.
A daily close above $0.2587 would confirm the structure staying intact and open the door toward $0.3279, roughly 55.6% above the current price.
Beyond that, $0.4380 comes into play, close to 107.9% higher than where ADA trades today, and the next major resistance overhead sits at $0.5114, which would mark a gain of about 142.7% from current levels if the move plays out in full.
The other side of this setup matters just as much.
If Price instead closes below $0.1709, that would confirm the ascending trendline has failed, roughly an 18.9% drop from here, and it would shift the near-term structure from bullish continuation to a corrective phase.
In that scenario, the next support to watch sits at $0.1534, about 27.2% below the current price, which is where dip buyers would likely look to step back in if the breakdown scenario unfolds.
For now, Price is sitting in a decision zone.
The higher high on the first retest keeps the bullish trendline scenario alive, but the daily close on either side of this range is what will determine which of these ADA price targets actually gets tested next.
Source: TradingView chart, Cardano ADA/USDT perpetual contract, Binance, 1D timeframe, snapshot dated September 5, 2026.
Support and Resistance Levels for Cardano
Level Type | Price | Change from CMP |
Resistance 3 (Major) | $0.5114 | +142.7% |
Resistance 2 | $0.4380 | +107.9% |
Resistance 1 | $0.3279 | +55.6% |
Breakout Trigger | $0.2587 | +22.8% |
Current Price (CMP) | $0.2107 | — |
Breakdown Trigger | $0.1709 | -18.9% |
Support 1 | $0.1534 | -27.2% |
Bull, Base, and Bear Case for Cardano
In the bullish case, Price holds its ascending trendline, daily closes push through $0.2587, and the added derivatives exposure from platforms like Polymarket keeps liquidity flowing in on the way up toward $0.3279 and eventually the $0.4380 to $0.5114 zone.
The base case has Cardano chopping around the current range for a while longer, testing the trendline once or twice more without a decisive daily close in either direction, essentially letting the market build more conviction before committing to a direction.
The bearish case shows up if sellers force a daily close under $0.1709. That would flip the recent higher-high structure on its head, and ADA would likely head toward the $0.1534 support zone as leveraged long positions get squeezed out given how much open interest is currently sitting in the market.
Risks to Watch
Leverage is the biggest wildcard here. With futures volume running well ahead of spot volume and open interest above $450 million, sharp wicks in either direction are more likely than usual, and a fast move can trigger cascading liquidations before the market settles into a genuine trend.
Broader crypto sentiment, regulatory headlines around derivatives platforms, and Cardano-specific ecosystem news can all override the technical picture in the short term, so these levels should be treated as a framework rather than a guarantee.
Key Terms
Ascending trendline: A line drawn along a series of rising lows that acts as dynamic support while price trends upward.
Higher high: A price peak that exceeds the previous peak, generally read as a sign of continued bullish momentum.
Open interest: The total number of outstanding derivative contracts that have not been settled, used as a gauge of active leveraged positioning.
Trendline breakdown: A close below a previously respected trendline, often signaling the end of the trend it was supporting.
Disclaimer
This article is for informational purposes only and does not constitute financial, investment, or trading advice. Cryptocurrency markets are highly volatile, and price predictions are based on technical analysis that can change quickly with new market data. Always conduct independent research and consult a qualified financial advisor before making investment decisions.
0
0

 Manage all your crypto, NFT and DeFi from one place
Securely connect the portfolio you’re using to start.


